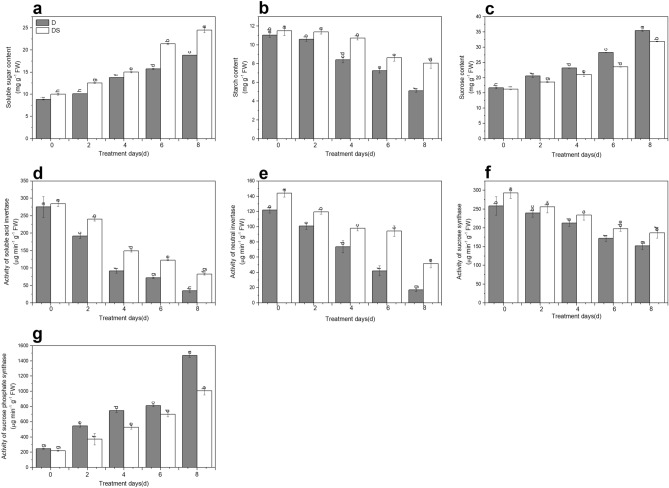
Figure 2.
Uniconazole-induced carbon metabolism-related indicators as soluble sugar content (a), starch content (b), sucrose content (c), activity of soluble acid invertase (d), activity of neutral invertase (e), activity of sucrose synthase (f) and activity of sucrose phosphate synthase (g) under drought stress. All data are presented as the means ± standard errors (n = 4). D and DS expressed as treatments under drought stress and drought stress + uniconazole, respectively.

