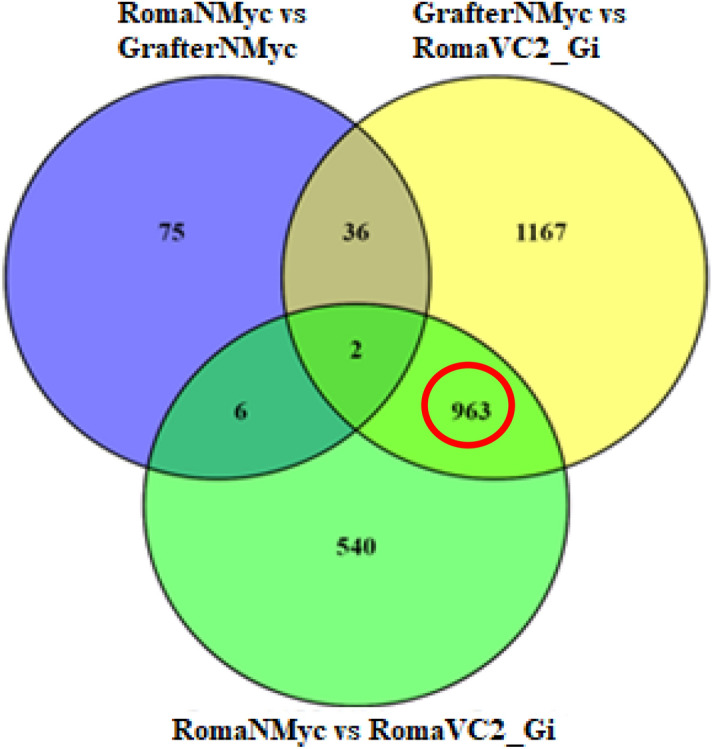
Figure 3.

Comparison of the number of differentially expressed genes (DEGs) (up and down-regulated) for the non-inoculated host and non-host with AM-inoculated host. Venn diagram represents DEG profiles at FDR ≤ 0.05 and − 2 ≤ log fold change ≥ 2. Genes exclusively expressed in the basal root transcriptome (without any AM inoculation) is represented by the non-overlapping area of the blue circle (RomaNMyc vs GrafterNMyc). Yellow circle (excluding overlap area) represents DEGs in AM-inoculated host (RomaVC2_Gi) compared to non-inoculated non-host (GrafterNMyc). Non-overlapping region of green circle represents DEGs in AM-inoculated host (RomaVC2_Gi) compared to non-inoculated host (RomaNMyc). The 963 genes constituting the overlapping region (light green) in these two sets, are DEGs specific to AM-inoculation in hosts (up- and down-regulation) as these do not overlap with basal root profiles (blue circle). These genes were selected for further characterization.
