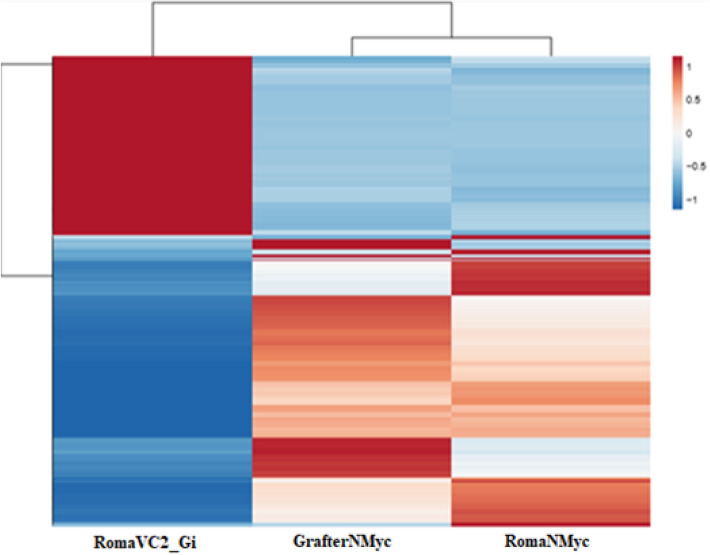
Figure 4.
Heatmap to visualize hierarchical clustering of AM symbiosis-specific genes (up- and down-regulated) between AM-inoculated host and non-inoculated host and non-host. This figure represents heatmap for 963 mycorrhization-specific genes obtained by comparative RNA seq analysis of AM-inoculated host (RomaVC2_Gi) with non-inoculated host (RomaNMyc) and non-host (GrafterNMyc) clearly depict a subset of genes that are strongly upregulated (red) and downregulated (blue) in mycorrhized host root (RomaVC2_Gi) when compared with both non- inoculated host (RomaNMyc) as well as non- host (GrafterNMyc).

