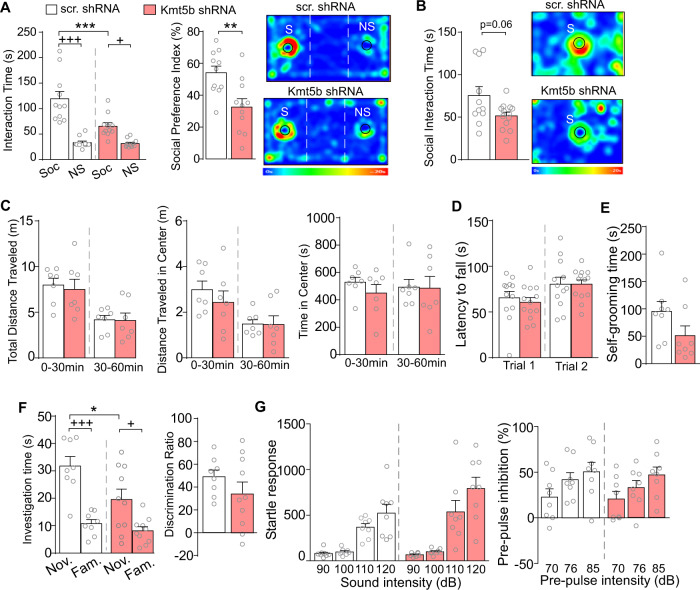
Fig. 2. Behavioral changes in mice with Kmt5b deficiency in PFC.
A Bar graphs showing the time spent in investigating the social (S) or nonsocial (NS) stimulus and the social preference index in three-chamber social preference tests of mice with PFC injection of scr. or Kmt5b shRNA AAV. Investigation time: ***p < 0.001 (scr. vs. Kmt5b), +++p < 0.001, +p < 0.05 (Soc. vs. NS), two-way ANOVA. Preference index: **p < 0.01, t-test. Inset: representative heat maps. B Bar graphs showing the time spent in investigating the social stimulus (S) in social approach tests of mice with PFC injection of scr. or Kmt5b shRNA AAV. Inset: representative heat maps. C Bar graphs showing the distance traveled (total and in center), as well as the time in center in locomotion tests of mice with PFC injection of scr. or Kmt5b shRNA AAV. Bar graphs showing the latency to fall in rotarod tests (D), the time spent in self-grooming (E), the time spent in investigating novel (Nov.) and familiar (Fam.) objects and the discrimination ratio in novel object recognition (NOR) tests (F) of mice with PFC injection of scr. or Kmt5b shRNA AAV. NOR: investigation time: *p < 0.05 (scr. vs. Kmt5b), +++p < 0.001, +p < 0.05 (Nov. vs. Fam.), two-way ANOVA. G Bar graphs showing startle responses and pre-pulse inhibition of mice with PFC injection of scr. or Kmt5b shRNA AAV.

