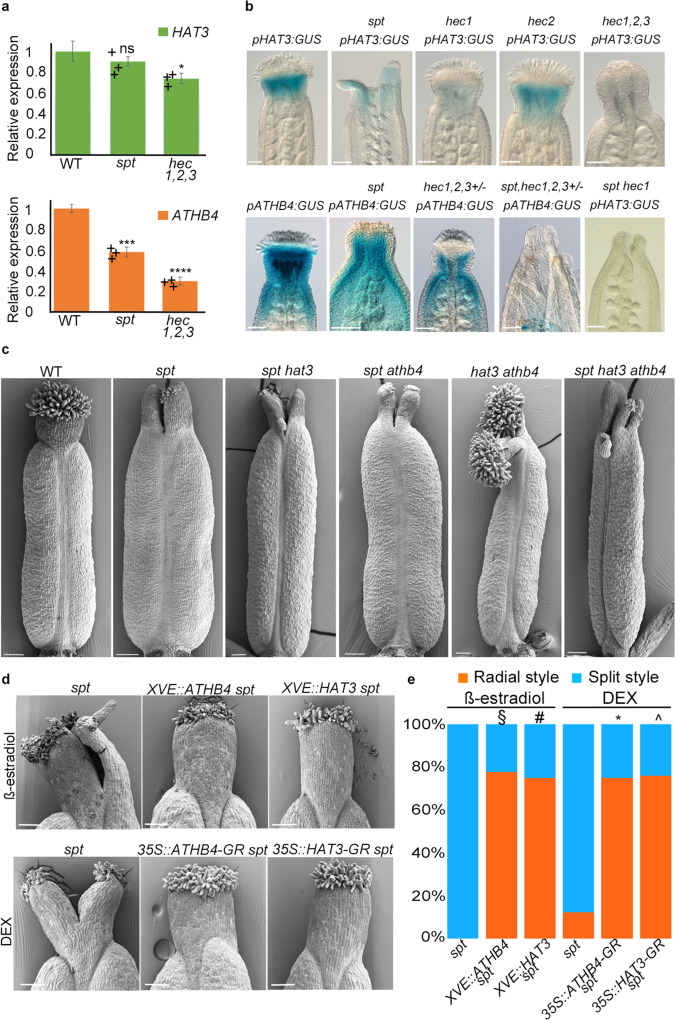
Fig. 2. SPT/HEC synergistic control of HAT3 and ATHB4 expression and genetic analyses.
a qRT-PCR of HAT3 and ATHB4 in Col-0, spt and hec1,2,3 mutant inflorescences normalised against UBIQUITIN10. The centre for the error bars represents mean, while error bars represent SD; *p < 0.05, ***p < 0.001, ****p < 0.0001, ns indicates no statistically significant difference (two-sided Student’s t test), n = 3 technical replicates. The panel displays similar results obtained from one of three biological replicates analysed, and up to six technical replicates for each gene and for each biological replicate were performed. b Optical images of stage-12 gynoecia showing pHAT3:GUS (top) and pATHB4:GUS (bottom) expression in Col-0, spt and combinations of hec1,2,3 and spt mutants, as depicted on individual panels. c SEM images of stage-12 gynoecia of Col-0, spt, spt hat3, spt athb4, hat3 athb4 and spt hat3 athb4. Scale bars represent 100 µm. b, c Similar results were obtained from three independent experiments. d SEM images of stage-13 styles of ATHB4 (XVE::ATHB4 and 35S::ATHB4:GR) and HAT3 (XVE::HAT3 and 35S::HAT3:GR) overexpression lines in spt background, treated with either 20 µM β-estradiol (top) or 10 µM DEX (bottom). Scale bars represent 100 µm. e Quantification of the radial (orange bars) and split (blue bars) style phenotype of HAT3 and ATHB4 overexpression lines (XVE::HAT3, XVE::ATHB4, 35S::HAT3:GR and 35S::ATHB4:GR) in spt background treated with mock, β-estradiol and DEX. Phenotypic classes were compared using contingency 2 × 2 tables followed by Pearson’s χ2 test. Two-tailed P values are as follows: spt-12 XVE::ATHB4 β-estradiol vs spt-12 β-estradiol P < 0.00001 (§); spt-12 XVE::HAT3 β-estradiol vs spt-12 β-estradiol P < 0.00001 (#); spt-12 35S::ATHB4:GR DEX vs spt-12 DEX P < 0.00001 (*); spt-12 35S::HAT3:GR DEX vs spt-12 DEX P < 0.00001 (^). P values < 0.01 were considered as extremely statistically significant.

