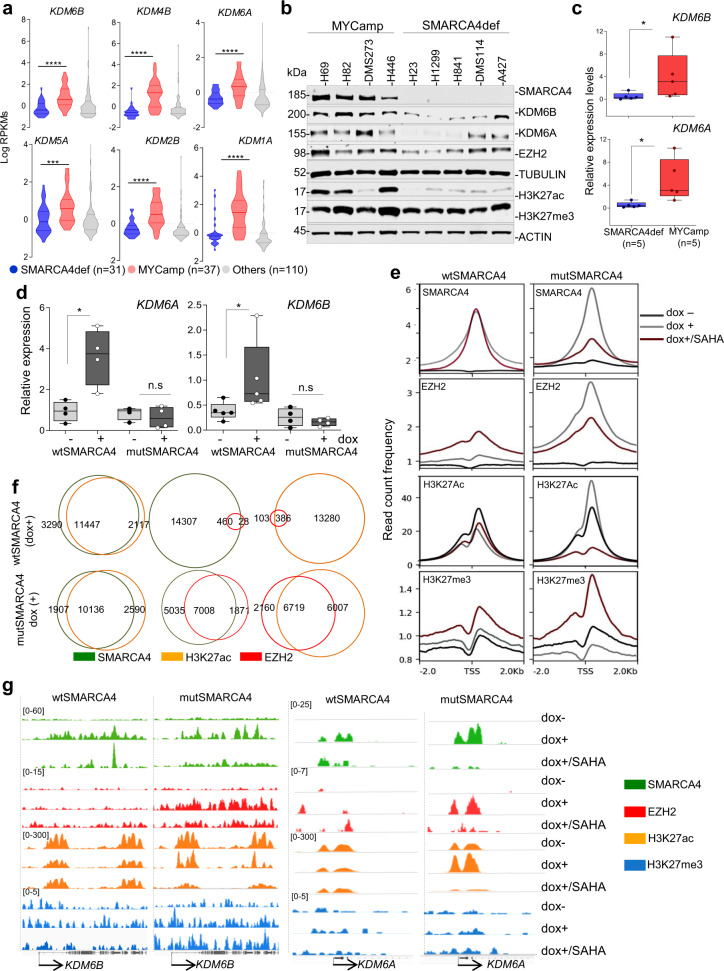
Fig. 2. SMARCA4 regulates the levels of the KDM6s.
a Violin plots comparing levels of the indicated KDMs in SMARCA4def (n = 31), MYCamp (n = 37) and other (wild type for SMARCA4 and for MYC) (n = 110) lung cancer cell lines (from the Cancer Cell Line Encyclopedia—CCLE at cBioportal). RPKMs (reads per million). Bars show mean ± SD. Two-sided unpaired Student’s t-test: ***P < 0.001; ****P < 0.0001. b Western blot depicting endogenous levels of the indicated proteins in lung cancer cell lines. TUBULIN and ACTIN, protein-loading control. c and d Real-time quantitative PCR of KDM6A and KDM6B (relative to ACTB) for comparing mRNA levels, for each individual cell line, among the indicated groups of lung cancer cell lines *P = 0.032 (KDM6B) and *P = 0.016 (KDM6A) (c), or in the H1299-wtSMARCA4 and H1299-mutSMARCA4 cell models (dox, doxycycline, 1 µg/mL; 72 h). *P = 0.029 (KDM6A) and P = 0.032 (KDM6B) (d). In box-whisker plots, the horizontal band inside box indicates the median, the bottom and top edges of the box 25th–75th percentiles and the whiskers indicate the min to max. Four and five biological replicates were included for the determination of the KDM6A and KDM6B levels, respectively, in the H1299 cell model. Bars show mean ± SD. Two-sided unpaired Student’s t-test, e Read count frequency of heatmaps, at ±2 kb regions centred on the transcriptional start site (TSS), of the indicated proteins and conditions in the H1299 cell model (dox, doxycycline, 1 µg/mL and SAHA 1 µM, for 72 h). f Venn diagrams representing overlap of SMARCA4, H3K27ac and EZH2 peaks in the indicated cells and under the stipulated conditions. g Representative snapshots from IGV of ChIP-seq profiles at selected target loci performed in H1299 cell models. A Source Data file is available for this figure.

