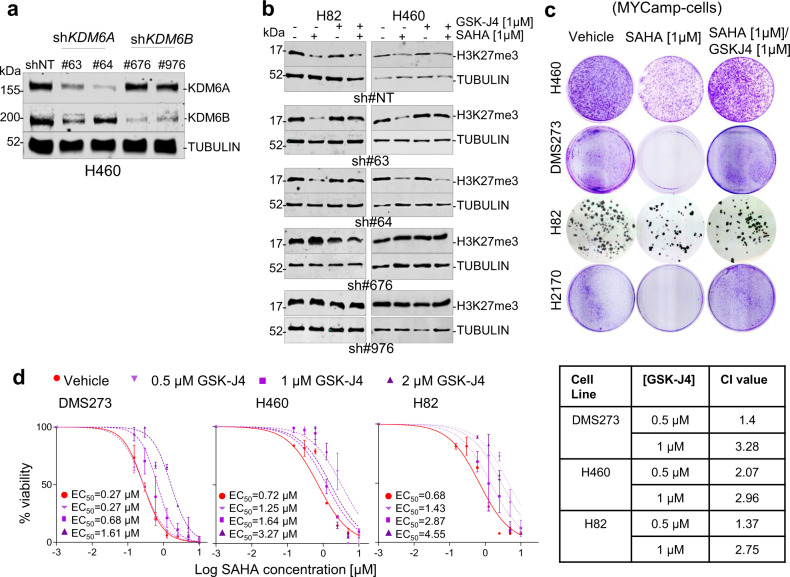
Fig. 3. KDM6B depletion mimics the response of SMARCA4-deficient cells to SAHA.
a Western blot depicting levels of KDM6s in H460 cells infected with the non-target short hairpin (shNT) and with different shKDM6A (#63 and #64) and shKDM6B (#676, #976). b Western blot depicting levels of H3K27me3 and cells infected with the shNT, shKDM6A (#63, #64) or shKDM6B (#676, #976) treated with GSK-J4 and/or SAHA for 72 h. c Representative clonogenic assays for the indicated cells and treatments. d Viability of indicated cell lines, measured using MTT assays, 5 days after treatment with increasing concentrations of SAHA and co-treated or not with GSK-J4 at different concentrations. Lines, number of viable cells relative to the untreated cells. Data are presented as mean ± SD from three replicate cell cultures in two experiments. EC50, half-maximal effective concentration. On the right, table presenting the combination index (CI) at the indicated concentrations of GSK-J4 (average CI from two independent experiments). CI < 1, CI = 1 and CI > 1 indicate synergism, additive effect, and antagonism, respectively. A Source Data file is available for this figure.

