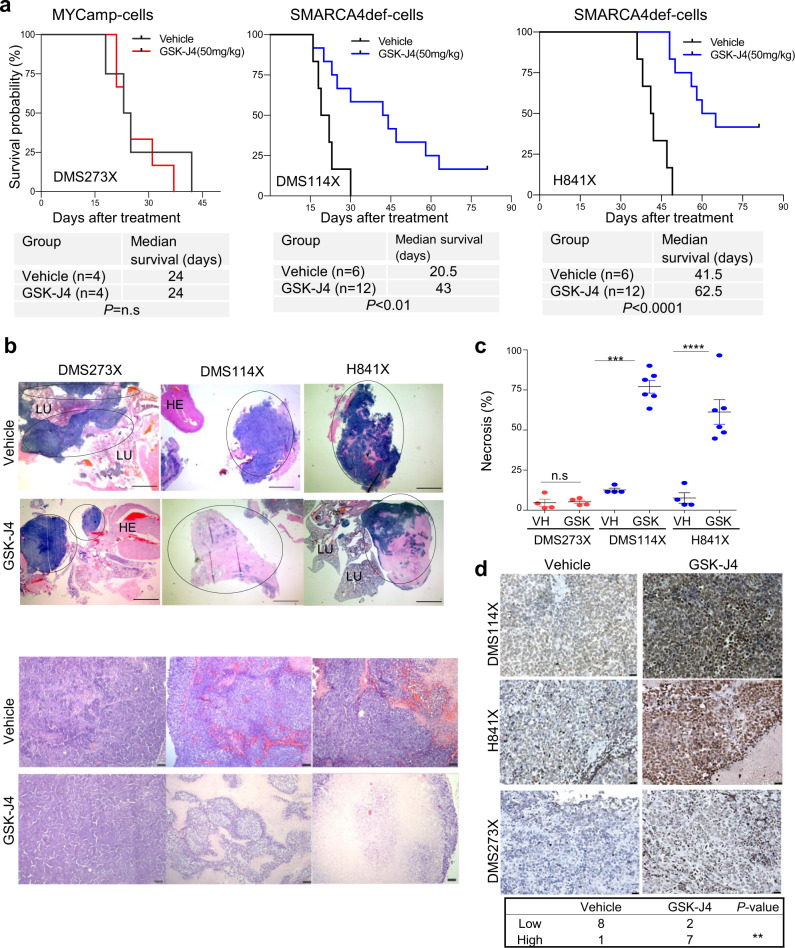
Fig. 6. GSK-J4 induces tumour regression of SMARCA4def lung tumours in vivo.
a Kaplan–Meier curves showing overall survival for GSK-J4-treated compared with vehicle control groups of each indicated orthotopically implanted mice model. Panels below, number of mice (n) and mean survival times for each group of treatment and cell line. P-values from the two-sided log-rank (Mantel–Cox) test of the plots are included. **P < 0.01; ****P < 0.0001. n.s., not significant. b Representative sections of haematoxylin and eosin (H&E) staining of tumours from the indicated cells, from mice treated with either GSK-J4 or vehicle. Upper panels, tumour regions are marked within circles. Scale bars, 2.5 mm. The pink areas inside the tumours indicate necrosis. HE heart, LU lung. Bottom panels, representative sections, at higher magnification, of tumours from the indicated cells and treatments. Scale bars, 50 µm. c Quantification of necrotic areas. Mean ± SD are indicated for each group. The number of tumours, each from a different individual, were n = 4 in each VH and GSK-J4 treated groups for the DMS273X mice; n = 4 in the VH and n = 5 in the GSK-J4 groups, for the DMS114X mice and n = 4 in the VH and n = 6 in the GSK-J4 groups, for the H841X mice. Two-sided unpaired Student’s t-test. ***P = 0.0006; ****P < 0.0001. VH vehicle. d Representative immunostaining of H3K27me3 in tumours from the indicated cells and treatments. Scale bars, 25 µm. Below, distribution of H3K27me3 staining among tumours (three tumours per cell line and condition) from the DMS273X, H841X and DMS114X tumours treated with vehicle or GSK-J4. Low (intensity values 1 and 2); high (intensity values 3 and 4) (Supplementary Table 6). Two-sided Fisher’s Exact test. *P < 0.05. A Source Data file is available for this figure.

