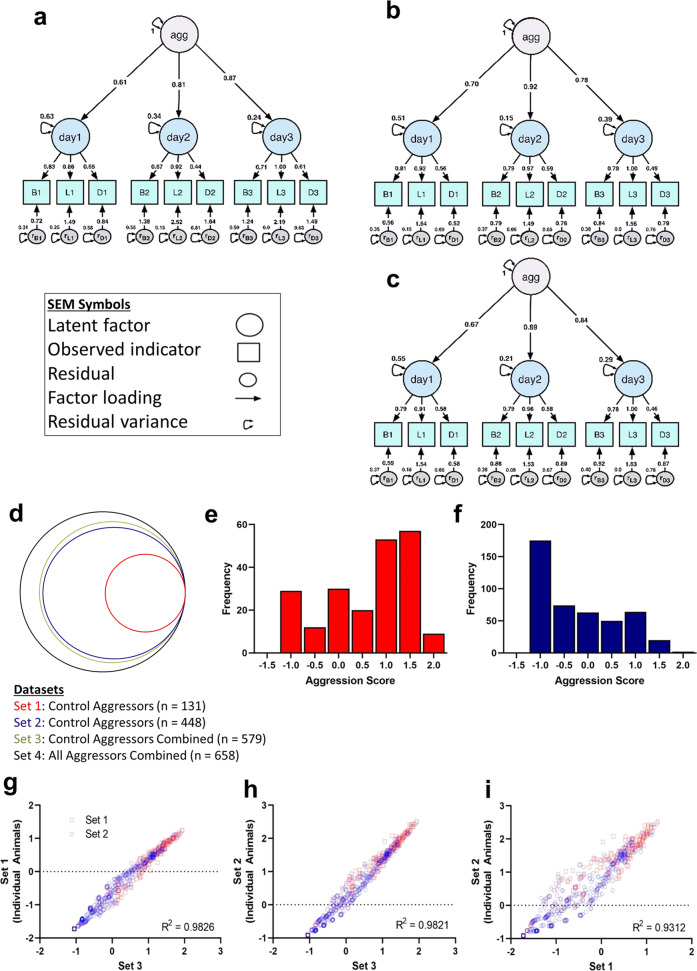
Fig. 2. Aggression scores are significantly correlated across datasets.
The final model (MAD) is a second-order measurement model wherein the observed variables are grouped by trial day before loading onto the higher-order factor, aggression. a–c In each path diagram, circles represent latent (unobservable) factors, including an overall aggression score as well as a behavior score on days 1–3, while squares represent the observed indicators, bouts, latency, and duration, on days 1–3, and small circles with double-headed arrows represent indicator residuals and residual variance. Arrows containing factors loadings, or regression weights, are interpreted as regression coefficients, denoting the change in the indicated variable, latent or observed, for every one unit change in the higher-order factor the arrow descends from. These values along with other model estimates are used in a multivariate formula to calculate aggression scores. MAD was developed three times using experimentally naïve aggressor data, thereby generating model estimates unique to (a) Set 1 (n = 131), b Set 2 (n = 448), and (c) Set 3 (n = 579). d–i Application of MAD to Sets 1–3 generated three sets of model parameters from which three sets of aggression scores were calculated for Set 4 (n = 658). d Schematic representing the four primary datasets used in this analysis. The distributions of aggression scores calculated with Set 3 model estimates are depicted in separate histograms for (e) Set 1 and (f) Set 2 datasets. Correlation analyses showed positive relationships between scores calculated using (g) Sets 1 and 3 parameters (p < 0.0001); h Sets 2 and 3 parameters (p < 0.0001); and (i) Sets 1 and 2 parameters (p < 0.0001).

