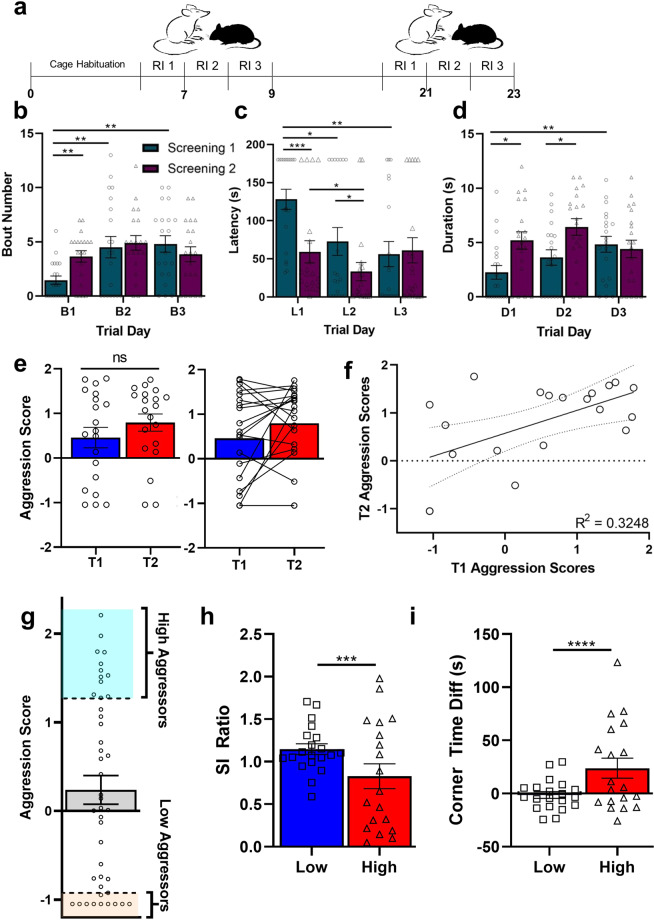
Fig. 3. Aggression scores are stable over time and predict CSDS utility.
a Schematic showing experimental timeline. Aggression was measured via the resident-intruder procedure at two different time points beginning on days 7 and 21 in a novel cohort of 20 mice. b–d The raw screening data for bouts, latency, and duration on trial days 1–3 are compared between Screening 1 (T1) and Screening 2 (T2). b Across screenings, there was a main effect of trial day (p < 0.001) as well as an interaction effect between trial day and screening (p < 0.05). At T1, there was a increase in bouts on day 2 versus day 1 (p < 0.01) and day 3 versus day 1 (p < 0.01). At T2, there were no differences in bout number between trial days. Between T1 and T2, we found a increase in the number of bouts on day 1 (p < 0.01), but not on days 2 or 3. c For latency, there were main effects of both trial day (p < 0.01) and screening (p < 0.01) as well as an interaction effect between trial day and screening (p < 0.01). At T1, latency decreased compared to day 1 on days 2 (p < 0.05) and 3 (p < 0.01) whereas only latency between days 1 and 2 at T2 (p < 0.05) decreased. Latency on days 1 (p < 0.001) and 2 (p < 0.05) decreased between T1 and T2. d At T1, we found an increase in duration between days 1 and 3 (p < 0.01), but there were no other differences at T1 or T2. Between T1 and T2, there was an increase in duration on days 1 (p < 0.05) and 2 (p < 0.05). e A paired t-test of aggression scores at Time 1 and Time 2 demonstrates no differences in aggression (p > 0.05). Among the top most aggressive animals, however, the majority maintained aggression during the two screenings. f Aggression scores are correlated for individual animals between T1 and T2 (p < 0.01). A simple linear regression analysis demonstrates a relationship between aggression scores at T1 and T2 (p < 0.01). g A cohort of 42 aggressors was screened and those with the top 10 MAD scores (high aggressors) and bottom 10 scores (low aggressors) were chosen for subsequent CSDS. Adult male C57 mice exposed to CSDS with high aggressors showed reduced social interaction (h) and increased time in the corners (i) compared to those exposed to low aggressors. ****p < 0.0001, ***p < 0.001, **p < 0.01, *p < 0.05; error bars indicate SEM.

