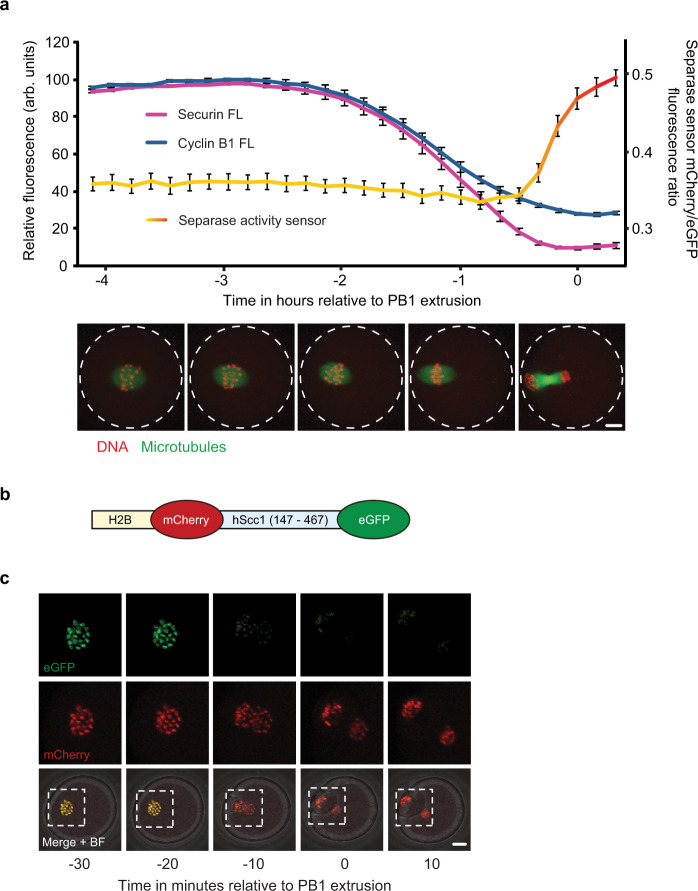
Fig. 1. Securin destruction begins 2 hours ahead of separase activation in mouse oocyte meiosis I.
a Graph showing the mean destruction profiles of VFP-tagged securin FL (magenta trace, n = 25) and cyclin B1 FL (blue trace, n = 62) alongside separase activity as determined by a separase activity biosensor (mCherry/eGFP ratio, n = 21) in MI mouse oocytes relative to PB1 extrusion. Error bars ± SEM. Representative confocal images show a maturing oocyte expressing Map4-GFP (microtubules in green) and incubated with SiR-DNA (DNA in red) at times relative to the x axis of the graph. Scale bar = 10 µm. b Schematic diagram of an H2B-mCherry-Scc1-eGFP separase activity biosensor. c Representative time-lapse images of an oocyte expressing the separase activity biosensor in Fig. 1b, imaged every 10 minutes at the times indicated relative to PB1 extrusion. eGFP (green), mCherry (red) and merged fluorescence + bright-field (BF) images are shown. Scale bar = 10 µm. eGFP and mCherry images correspond to the areas marked by the white dotted lines in the merge + BF images. Images displayed in a and c are representative of between 10 and 20 oocytes from experiments repeated at least three times.

