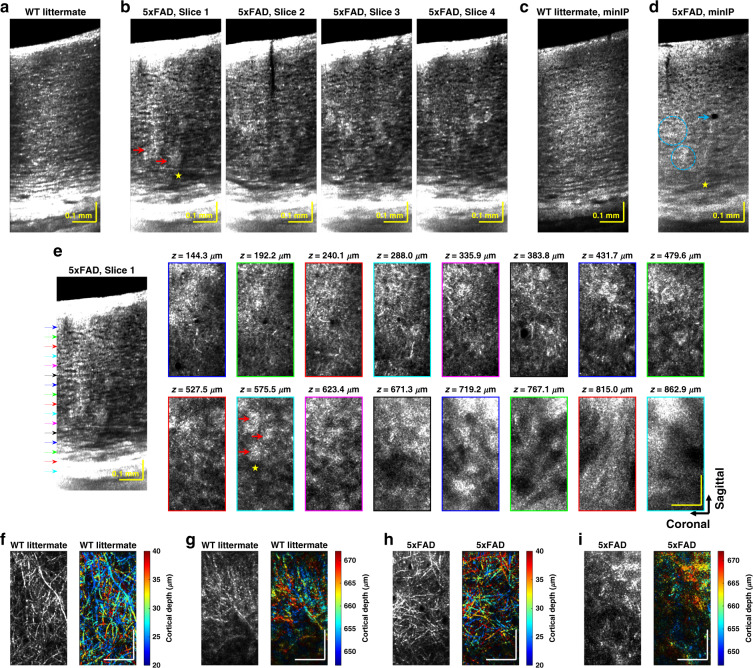
Fig. 6. OCM of Alzheimer’s disease mouse model.
Compared to the WT littermate (a), the 5xFAD transgenic mouse (b) has distinct highly scattering clusters (red arrows) and wide hyporeflective regions (yellow asterisk). Corresponding histology (Supplementary Fig. S7) suggests that the highly scattering clusters are plaques. Minimum intensity projection (minIP) image in the WT littermate (c) depicts clear cytoarchitecture, which is lacking in the AD mouse in deeper cortical layers (d, cyan circles). Hyporeflective voids, potentially related to tissue loss, are also noted (cyan arrow). e AD-associated plaques (red arrows) and regions of possible demyelination (yellow asterisk) are visualized in the en face plane. Outline colors of en face images correspond to arrow colors on the sagittal image on the left, indicating projection locations. Sagittal slice summation thickness: 17.8 μm. Depth color-coded en face images of myelinated axons and corresponding grayscale images illustrate intact myeloarchitecture in the WT littermate (f–g), while suggesting demyelination in deeper layers of the AD mouse (h–i). Taken together, OCM depicts a higher incidence of abnormal findings in layers IV-VI, consistent with the higher disease burden (Supplementary Fig. S7). Axial projection depth of 16.0 μm and scalebar size of 0.1 mm apply to all the en face images in e–i

