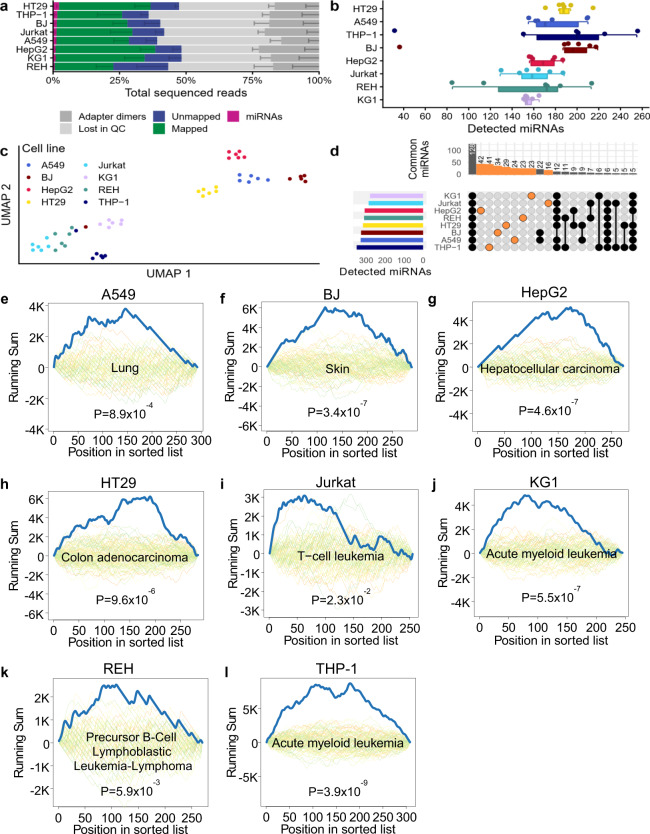
Fig. 3. Application of protocol SBN_CL to eight different cell lines.
a Read distribution for all tested cell lines, sorted by miRNA reads proportion. The data were presented as mean values ± the standard deviation (n = 6 biologically independent samples), which is shown as a smaller error bar in a darker color than its corresponding read group and only represented in one direction. b Detected miRNAs for every sample, sorted by decreasing average per cell line shown as boxplot (bottom) and dot plot (top). Each sample is shown as one dot and colored by protocol. Each dot represents one sample. The boxes span the first to the third quartile with the vertical line inside the box representing the median value. The whiskers show the minimum and maximum values or values up to 1.5 times the interquartile range below or above the first or third quartile if outliers are present. c UMAP embedding of all samples. Each dot represents one sample. d Upset plot showing the miRNAs jointly detected in multiple cell lines, or exclusively found in only one cell line (orange). The bar plot at the top shows on the y-axis the number of miRNAs detected in the cell lines highlighted by connected black or orange dots in the grid below. The bar plot on the left shows on the x-axis the total number of miRNAs detected in at least one of the samples of the cell line shown on the y-axis. e–l Examples of significantly enriched categories for each of the analyzed cell lines. Each plot shows the computed running sum (blue), running sums of random permutations (background), and the FDR adjusted P value for the cell line specified in the title. Exact p values were computed by the gene set enrichment analysis implementation of miEAA for each enrichment and FDR adjusted, separately for each database. Source data are provided in the Source Data file.

