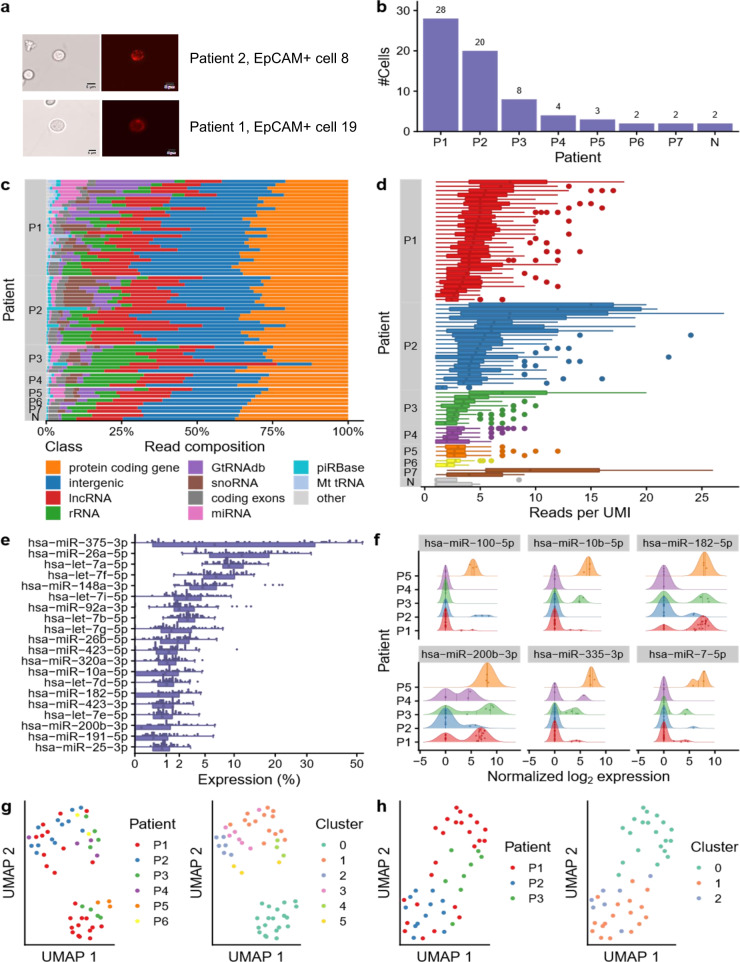
Fig. 4. Application of protocol SBN_CL to CTCs of small cell lung cancer (SCLC) patients.
a Representative images of two EpCAM+ cells enriched from blood samples of two SCLC patients (20x). The cells were isolated by micromanipulation for miRNA sequencing. The scale bar is equivalent to 5 µm. b Number of cells sequenced per patient and the two empty negative controls. c Distribution of the mapped reads for each cell grouped per patient and ordered by descending miRNA proportion. d Boxplot showing the number of reads per UMI for each cell, grouped by the patient in descending order. Each miRNA is shown as one dot. The boxes span the first to the third quartile with the vertical line inside the box representing the median value. The whiskers show the minimum and maximum values or values up to 1.5 times the interquartile range below or above the first or third quartile if outliers are present. e Distribution of the top 20 most expressed miRNAs across all cells shown as boxplot (bottom) and dot plot (top). The boxes span the first to the third quartile with the vertical line inside the box representing the median value. The whiskers show the minimum and maximum values or values up to 1.5 times the interquartile range below or above the first or third quartile if outliers are present. f Expression distribution of the six most variable miRNAs. Patients with less than three cells were excluded. The vertical lines inside the areas delimit the quartiles. The dots inside the area represent the expression of a miRNA in the cell of the corresponding patient. g UMAP embedding of all samples colored by the patient (left) and colored by cluster (right). h UMAP embedding of the three patients with the highest number of CTCs colored by the patient (left) and colored by cluster (right). Source data are provided in the Source Data file.

