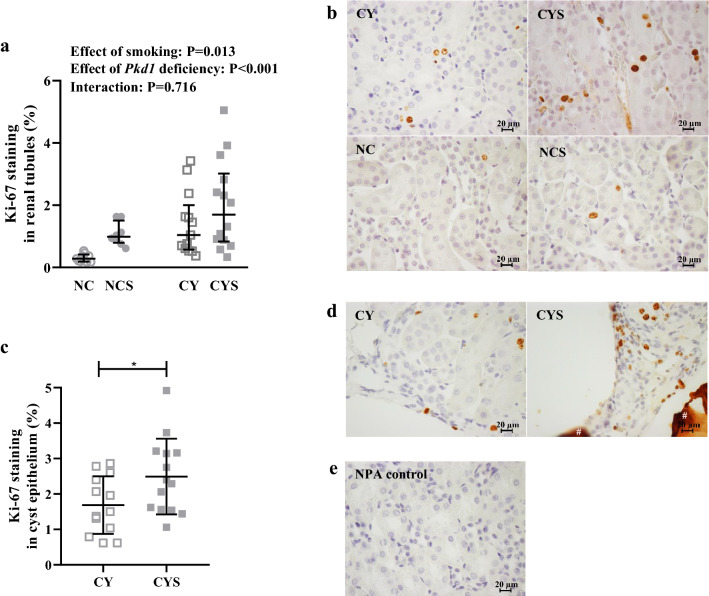
Figure 4.
(a) Analysis of the effects of smoking and Pkd1 deficiency in tubular epithelial cell proliferation on NC (n = 9), NCS (n = 8), CY (n = 13) and CYS (n = 14) mice. This analysis was carried out using aligned rank transform followed by two-way analysis of variance. (c) Comparative analysis of cell proliferation in renal cystic epithelium between CY (n = 13) and CYS (n = 14) animals. This comparison was performed using unpaired t-test. *P < 0.05. (b,d) Representative images of Ki-67 staining in renal tubular epithelium and cystic epithelium, respectively. # Extracellular protein aggregate non-specifically stained. (e) Negative control without primary antibody (NPA control) corresponding to the Ki-67 staining images shown in b and d. (b,d,e): Original magnification, × 400; bar = 20 µm.

