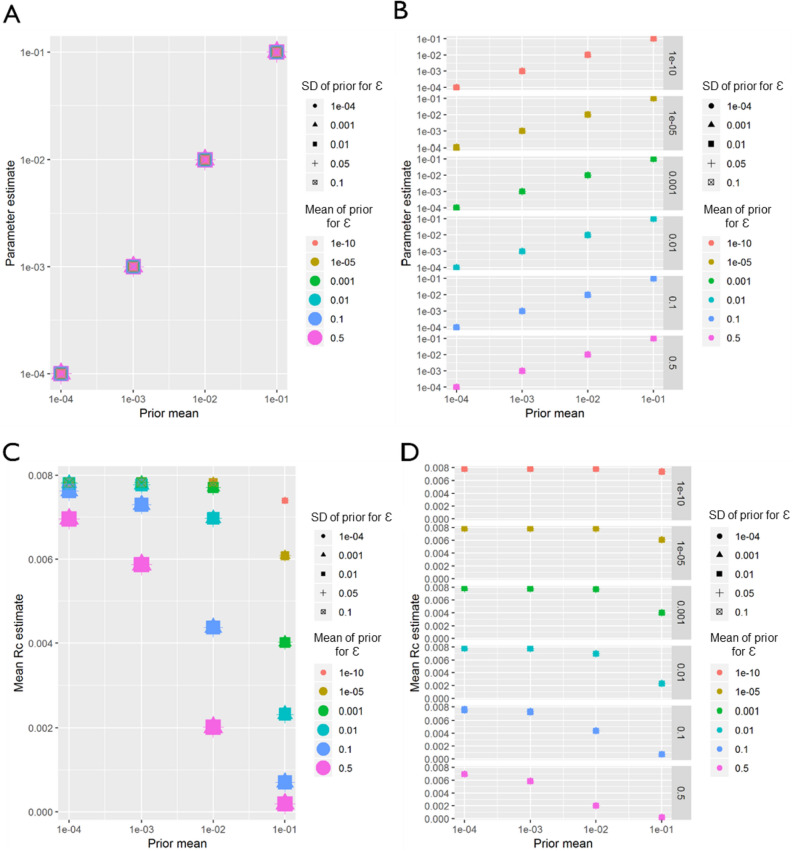
Figure 11.
China (P. falciparum) Sensitivity Analysis. Sensitivity analysis showing the impact of varying the prior means for P. falciparum in China. Sensitivity analysis showing the impact of varying the prior means for Eswatini. Sensitivity analysis showing the impact of varying the prior mean for the distance kernel shaping parameter, β. The different colours and shapes represent different means and standard deviations respectively of the normally-distributed prior of epsilon, ε, which represents shapes represent different hazards of infection by an external, unobserved source. For (A)–(D), the x-axis represents the prior mean used for β. (A) the y-axis shows the maximum a posteriori parameter estimate for the parameter β. (B) shows the same results, stratified by the prior mean of ε for clarity. (C) Shows the impact of priors for β and ε on the mean Rc estimate, and again (D) shows the same result, stratified by the prior mean of ε.

