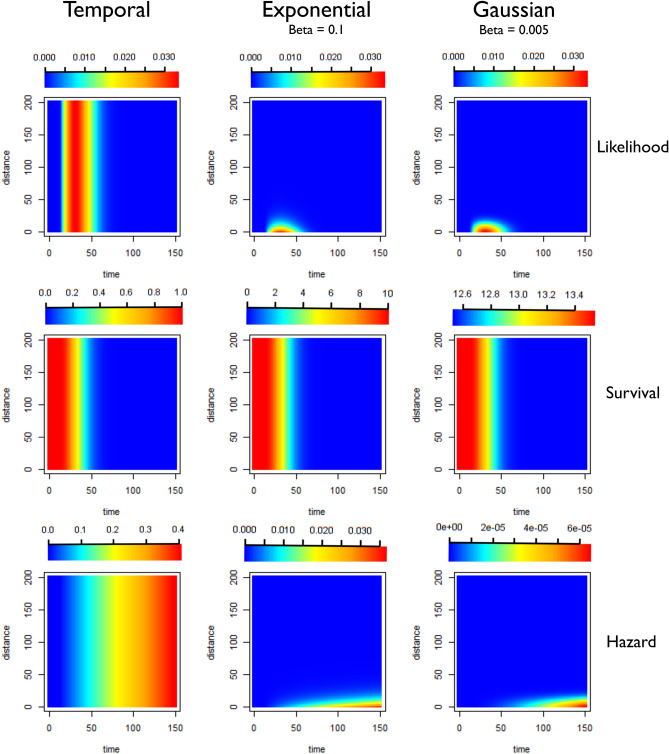
Figure 15.
Illustration of likelihoods, hazards and survivals for highly restrictive kernels (Human movement unlikely, most movement under 10 km). Plots showing how the pairwise likelihoods, survivals and hazards vary with time and distance under different model structures. The first row of plots shows the pairwise likelihoods, the second row shows the pairwise survival and the third row shows the pairwise hazard values for different combinations of distance (in kilometres) and time between symptom onset (days). The first column shows the results for a time-only version of the algorithm. The second column shows results for an exponential kernel and the third column shows results for a Gaussian kernel. In this example more restrictive values for beta, the shaping parameter for the distance kernels have been chosen, representing a context where there is very little movement of parasites, with very little movement beyond 10–20 km expected.

