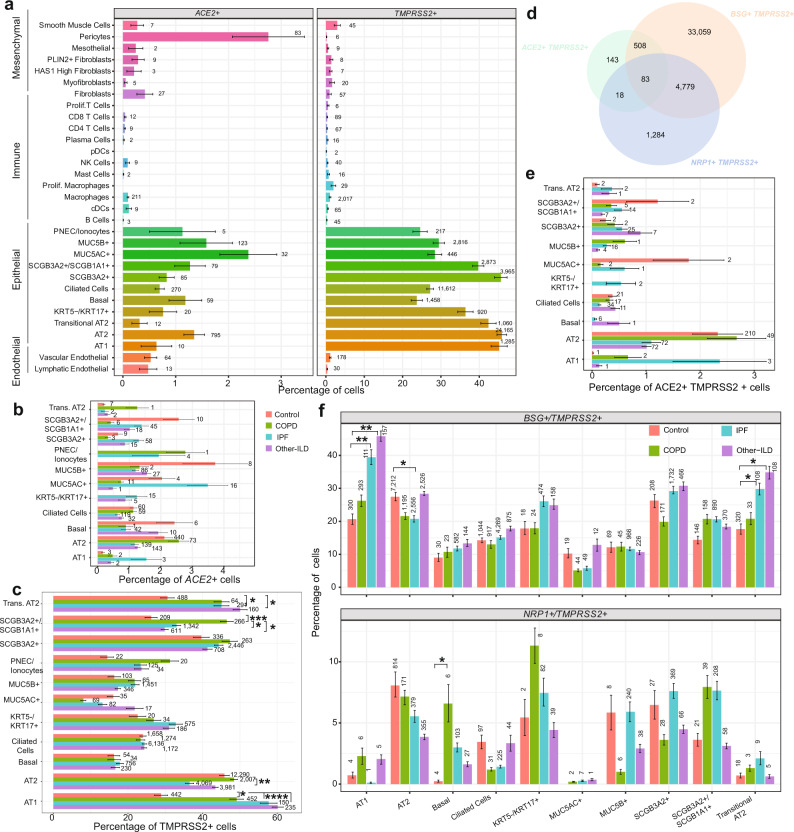
Fig. 1. Percentage of cells expressing SARS-CoV-2 receptor genes in lung cell types in different diagnosis subgroups.
a Percentage of cells expressing ACE2 and TMPRSS2 in all cell types. Numbers are the total number of ACE2 + or TMPRSS2 + cells in each cell type in the dataset. b, c Percentage of cells expressing ACE2 (b) and TMPRSS2 (c) in each diagnosis group in the epithelial cell types. d Venn diagram shows overlapping of cells co-expressing the proposed receptors (ACE2, BSG and NRP1) and the protease TMPRSS2. e, f Percentage of cells co-expressing receptors and TMPRSS2 split by cell type and diagnosis group. Plots were generated with mean values of percentage of cells per individual samples, and data are presented as mean values ± SEM. Significant differences between diagnosis groups were calculated using Tukey_HSD test, p value < 0.05: *p value < 0.01: **p value < 0.001: ***p value < 0.0001: ****.

