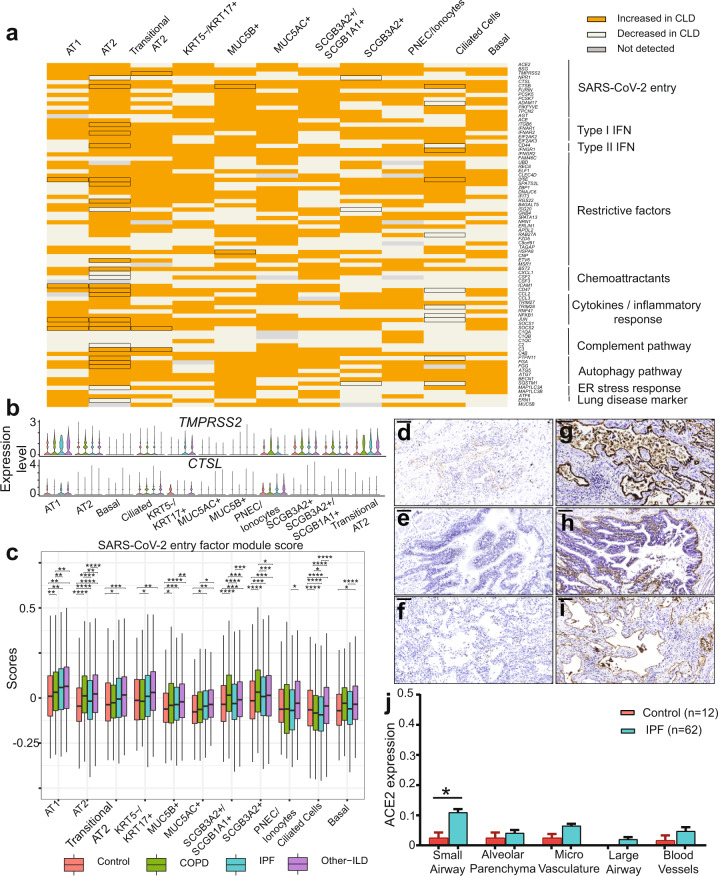
Fig. 2. Expression profile of SARS-CoV-2 mediators and response genes in the epithelial cell population.
a Binary heatmap representing a manually curated list of genes associated with SARS-CoV-2. Orange elements indicate genes with increased expression and white elements indicate genes with decreased expression in CLD samples; Not detected: gene expression was not detected in either of the two tested populations (CLD vs. Control). Differential expressed genes (DEGs) between CLD and control samples (FDR ≤ 0.1) are outlined in black. b Violin plot depicts gene expression level in CLD and control of the two SARS-CoV-2 proteases TMPRSS2 and CTSL. c SARS-CoV-2 entry module score in different cell types, SARS-CoV-2 mediators included ACE2, BSG (CD147), NPR1, HSPA5 (GRP78), TMPRSS2, CTSL, ADAM17, FURIN. The outliers were removed in this plot, please see Supplementary Fig. 8a with outliers included. Boxes: interquartile range, lower and upper hinges correspond to the first and third quantiles, upper and lower whisker extends from the hinge to the largest values or smallest values of 1.5 x interquartile range; *p value < 0.05, **p value < 0.01, ***p value < 0.001, ****p-value < 0.0001, Tukey_HSD post-hoc test. ACE2 and ITGB6 protein expression in IPF lung sections. IPF lung sections stained for ACE2: d small airway, e large airway and f lung parenchyma. IPF lung sections stained for αvβ6: g small airway, h large airway and i lung parenchyma. j Semi-quantitative evaluation of ACE2 scoring among control (n = 12 for each tissue) and IPF (n = 62 for each tissue) sections (both the percentage of staining and staining intensity of ACE2 expression; 0-Negative; 1–0–⩽10%; 2-11–⩽25%; 3-⩽26%), data are presented as mean values ± SEM. Significant differences between IPF and control were calculated using Tukey HSD test, p value < 0.05 *. Scale bar = 100 µm. For d–j: a total of 12 normal lung samples and 62 IPF samples were used.

