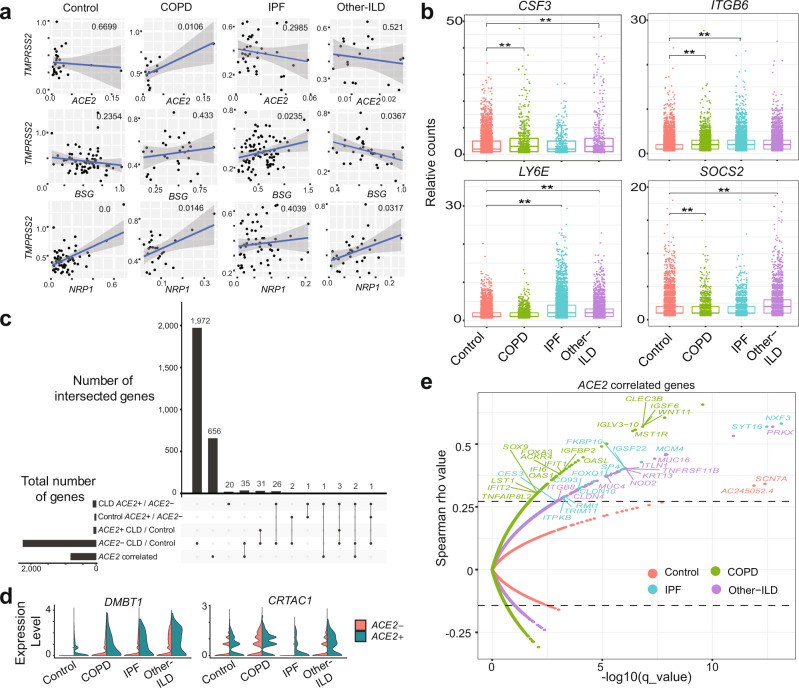
Fig. 3. CLD AT2 cells exhibit baseline differences in gene expression profile coping with viral infection.
a Significant gene expression correlation in AT2 cells between TMPRSS2 and ACE2, BSG (CD147) and NPR1 in COPD and IPF samples, each dot represents the average expression level of the genes of interest per sample, pairwise gene correlation analysis was done using a fitting linear model and p value was calculated using Anova. b Boxplot shows differences in gene expression of selected SARS-CoV-2 response genes in the AT2 cell types among different diagnosis groups, Boxes: interquartile range, lower and upper hinges correspond to the first and third quantiles, upper and lower whisker extends from the hinge to the largest values or smallest values of 1.5 × interquartile range; **p value-adj ≤ 0.05 (negative binomial test, corrected for Age, Ethnicity, Smoking_status and Dataset). c Upset plot shows shared differential expression genes (DEGs) between different comparisons: ACE2− CLD vs. Control, ACE2 + CLD vs. Control, CLD ACE2 + vs. ACE2-, Control ACE2 + vs. ACE2- and ACE2 correlated genes in the AT2 cells. d Upregulation of two genes uniquely differentially expressed in the CLD ACE2 + vs. ACE2−. e Spearman gene correlation analysis identified genes correlated with ACE2 expression in AT2 ACE2 + cells in different diagnosis groups, p-value was adjusted using Benjamini-Hochberg corrections, dashed lines indicate the 99th percentile of Spearman rho values.

