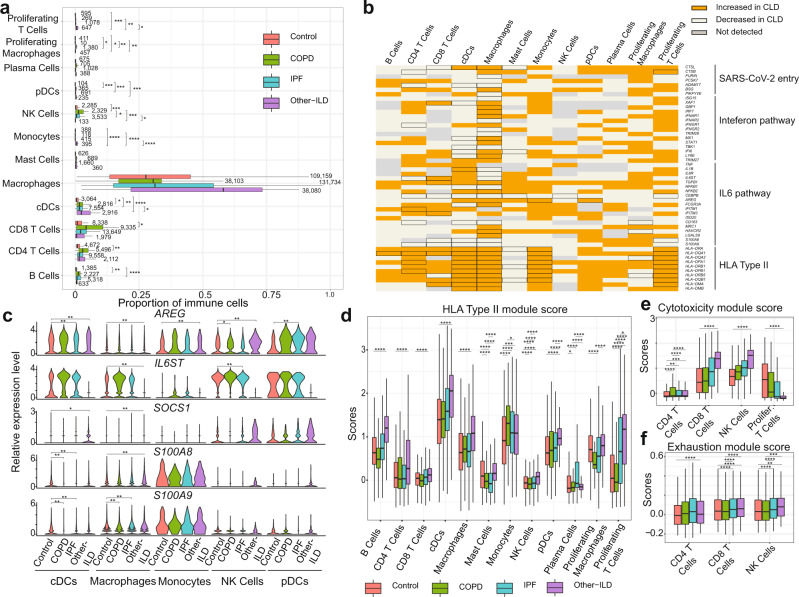
Fig. 4. Analysis of SARS-CoV-2 candidate immune response genes in immune cells.
a Quantification of cell types as a percent of all immune cells in control and diseased lungs, numbers represent the total numbers of the cell type per individual samples, data are presented as mean values ± SEM. b Binary heatmap representing a manually curated list of genes associated with SARS-CoV-2. Orange elements indicate genes with increased expression and white elements indicate genes with decreased expression; Not detected: gene expression was not detected in either of the two tested populations (CLD vs. Control); DEGs with FDR ≤ 0.1 are outlined in black. c Differential expression analysis for SARS-CoV-2 immune candidate genes in cDCs, Macrophages and Monocytes. *p-adjusted value < 0.1, **p-adjusted value < 0.05, p-adjusted value was Bonferroni adjusted from Seurat FindMarkers differential expression analysis using a negative binomial test and corrected for Age, Ethnicity, Smoking_status and Dataset. d Compared to the healthy control samples, HLA type II score is higher in all disease groups (especially Other-ILD). In the T cell population, cytotoxicity scores (e) and exhaustion scores (f) are higher in the disease samples than in control samples. In a, d, e, and f: Boxes: interquartile range, lower and upper hinges correspond to the first and third quantiles, upper and lower whisker extends from the hinge to the largest values or smallest values of 1.5 x interquartile range; Tukey_HSD post-hoc test: *p value < 0.05, **p value < 0.01, ***p value < 0.001, ****p value < 0.0001. See Supplementary Fig. 10 for plots with outliers included for d–f.

