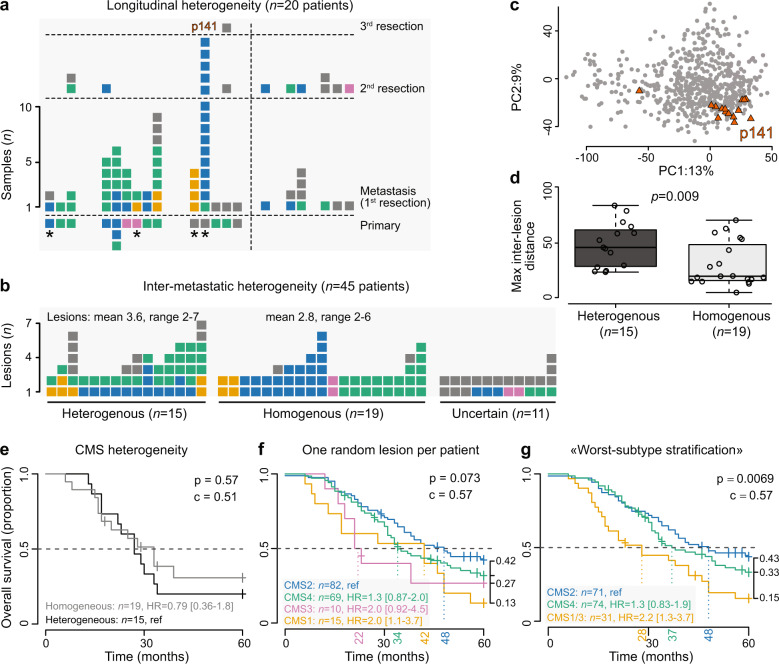
Fig. 3. Pronounced CMS heterogeneity in metastatic CRC.
Stacked barplots show intra-patient heterogeneity (each bar represents one patient and each square represents one tumor sample) of CMS assignments for patients with a matched primary tumors (classified with the original classifier)/longitudinal samples and liver metastases (classified with the new, tailored classifier; asterisk indicates patients with no neoadjuvant treatment), and b multiple resected metastatic lesions. c PCA plot illustrating transcriptomic heterogeneity for one patient with heterogeneous CMS classifications (p141), where most lesions are relatively similar and classified in the same CMS group, but with a single strong outlier sample with a different classification. d Boxplots (center line, median; box limits, upper and lower quartiles; whiskers, 1.5 × interquartile range) where patients with heterogeneous and homogeneous CMS classifications are compared with respect to maximum inter-lesion distance, calculated as Euclidean distances in the three-dimensional PC1–PC3 space. Kaplan–Meier survival estimates for patients with resected liver metastases, stratified by e inter-metastatic CMS heterogeneity, f CMS classification based on one randomly selected lesion per patient, and g “worst-subtype stratification” according to the following rule: if any lesion CMS1/CMS3, then patient CMS1/CMS3; if no CMS1/CMS3 and any lesion CMS4, then patient CMS4; if all CMS2, then patient CMS2. p-values were calculated by Wald tests, c is the concordance index, and HR is the hazard ratio. For survival analyses, each sample is assigned to the nearest (not necessarily confident) CMS.

