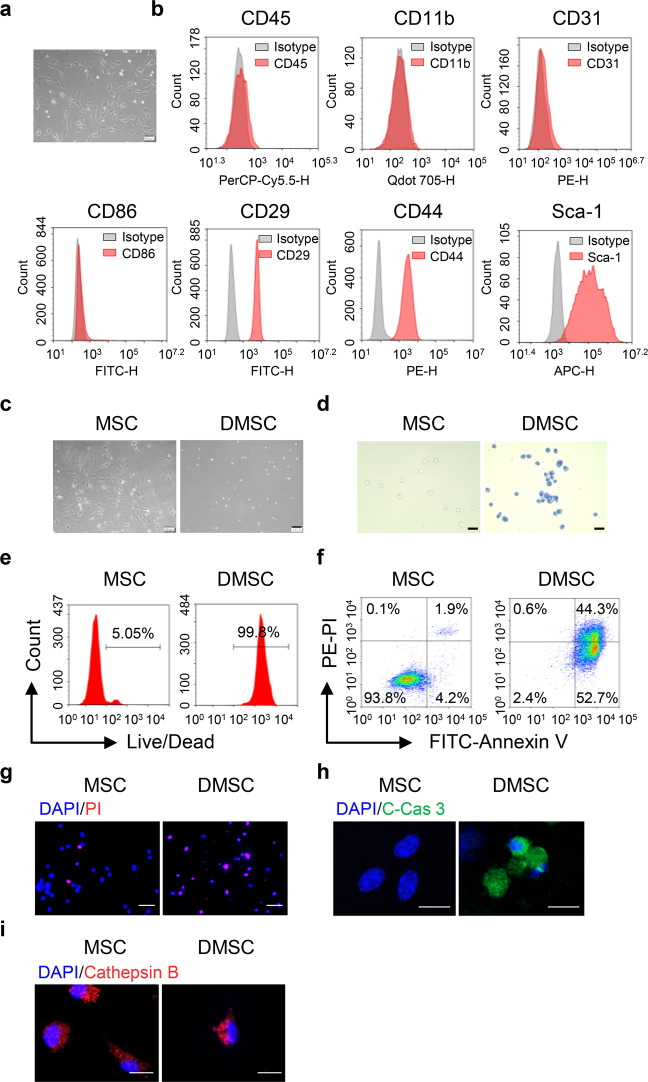
Fig. 1.
Culture and identification of MSCs and DMSCs. a The morphology of MSCs. Scale bar represents 100 μm. b MSCs were identified as CD45−CD11b−CD31−CD86−CD29+CD44+Sca-1+. c Morphology of living MSCs and DMSCs. Scale bar represents 100 μm. d Identification of living and dead MSCs by Trypan blue. Scale bar represents 100 μm. e Living and dead MSCs were stained using LIVE/DEADTM Near-IR Dead Cell Stain Kit and were analyzed by flow cytometry. f The apoptosis of MSCs and DMSCs detected by flow cytometry. g The PI staining of MSCs and DMSCs. Scale bar represents 50 μm. h, i The expression of cleaved caspase 3 (h) and Cathepsin B (i) in MSCs and DMSCs. Scale bar represents 10 μm. C-Cas 3, cleaved caspase 3

