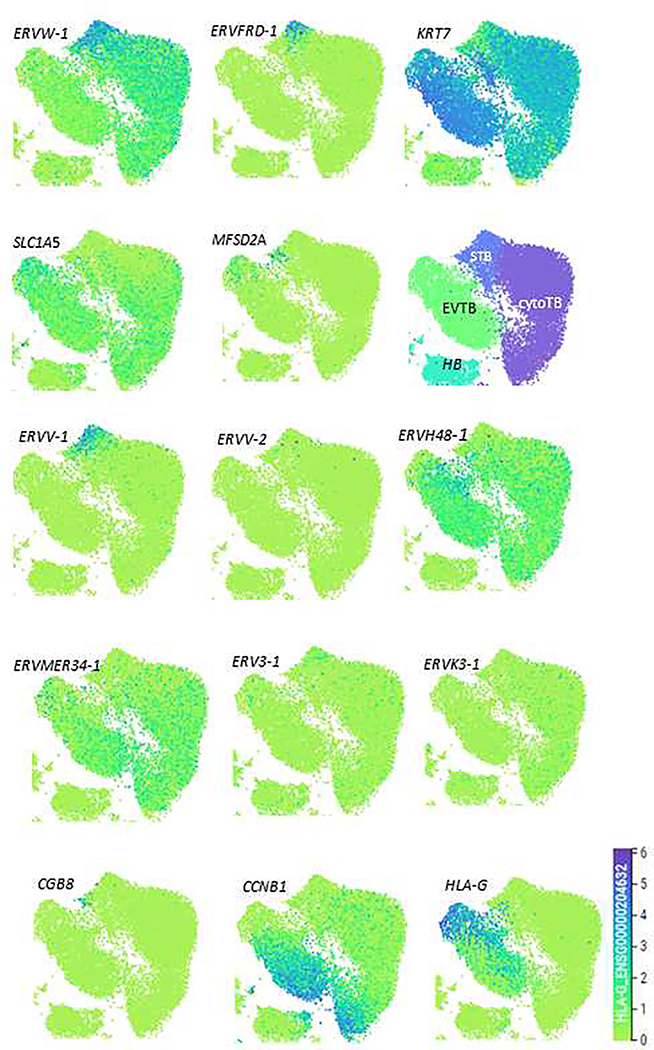
Fig. 2:
Placental cell clusters from 10x Genomics and Smart-seq2 (SS2) scRNA-seq analysis [1] derived from five first trimester placentas visualized by Uniform Manifold Approximation and Projection (UMAP), visualizing the distribution of syncytin gene transcripts for ERVW1, ERVFRD-1, ERVV-1, ERVV-2, ERVH48–1, ERVMER34–1, ERV3–1, & ERVK3–1, as well as for two putative receptors, SLC1A5 and MFSD2A, in the human placenta. Additionally, we map the location of the mRNA encoding the pan-TB marker KR7, the mature syncytiotrophoblast marker CGB8, and the EVT marker HLA-G, as well as CCNB1 (to indicate replicating cells). Relative expression of genes within individual cells (dots) is on an indigo-yellow scale (Bottom Right). Also shown is a map of cell types (HC: Hoffbauer cells). All data were derived by use of the web site provided by Vento-Tormo et al. https://maternal-fetal-interface.cellgeni.sanger.ac.uk/. Importantly, CGB8 expression is confined to a small cluster of cells in the syncytiotrophoblast region, a pattern consistent with the hypothesis that mature syncytiotrophoblast is probably poorly represented in the diagrams.

