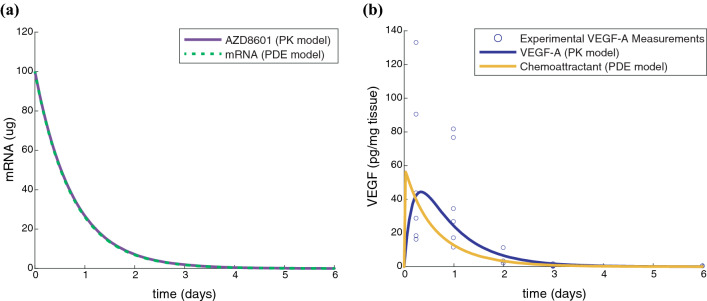
Figure 5.
VEGF generation rate is fit using pharmacokinetic model of AZD8601 injections. (a) PK model (solid purple line) and PDE model (dashed green line) predict mRNA amount (μg) following injection of 100 μg AZD8601. (b) Experimental measurements of VEGF-A concentration were taken at 6, 24, 48, 72, and 144 h after injection with 100 μg AZD8601 (blue circles). PK model (solid blue line) and PDE model (solid yellow line) predict temporal dynamics of VEGF-A concentration (pg/mg tissue) following injection of 100 μg AZD8601.

