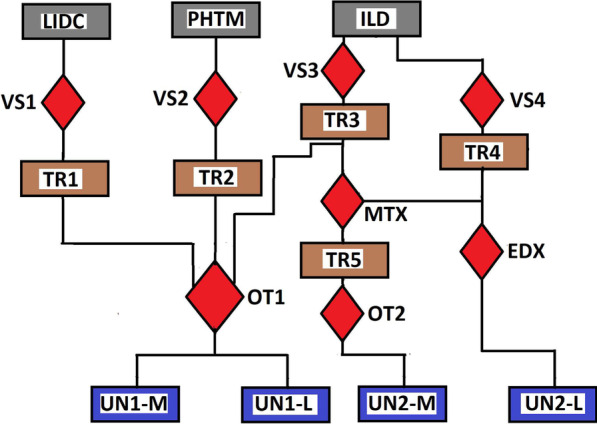
Fig. 3.

Flow chart for generating the second configuration of training data for UNET-1 and the training data for UNET-2 models. Three databases LIDR, PHTM and ILD were visually inspected (VS1, VS2, VS3) to select three sets of grayscale images (TR1, TR2, TR3). Otsu thresholding OT1 converts the three sets of images into binary images. The binary images are combined into a single set and further classified into two categories; the training images UN1-M and training labels UN1-L for the training of UNET-1. The ILD database is again visually inspected VS4 to select a set of expert-annotated masks TR4 that corresponds to grayscale images in TR3. The corresponding images in TR3 is multiplied MTX with TR4 to obtain new set of images TR5. The TR5 is converted to a binary image using Otsu thresholding OT2 and are tagged the training images UN2-M for UNET-2. Canny edge detector EDX extract edge images from TR4 and these edge images are tagged the training labels UN2-L for UNET-2
