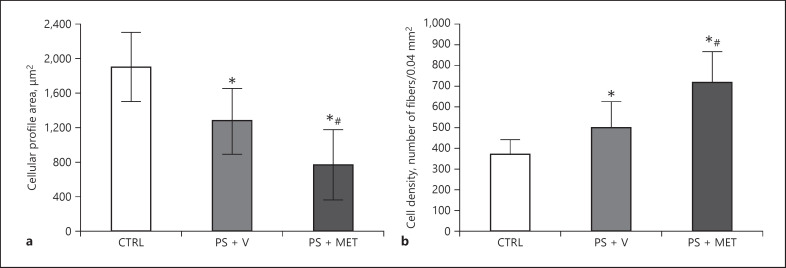
Fig. 4.
Cellular profile area (a) and cell density (b) from masseter muscle of rats submitted to sleep deprivation and treated with metyrapone. Results presented as mean and SD. *p < 0.05 when compared to CTRL; #p < 0.05 when compared to the PSD + V group. CTRL, control group; PSD + V, paradoxical sleep deprivation and vehicle; PSD + MET, paradoxical sleep deprivation and metyrapone.

