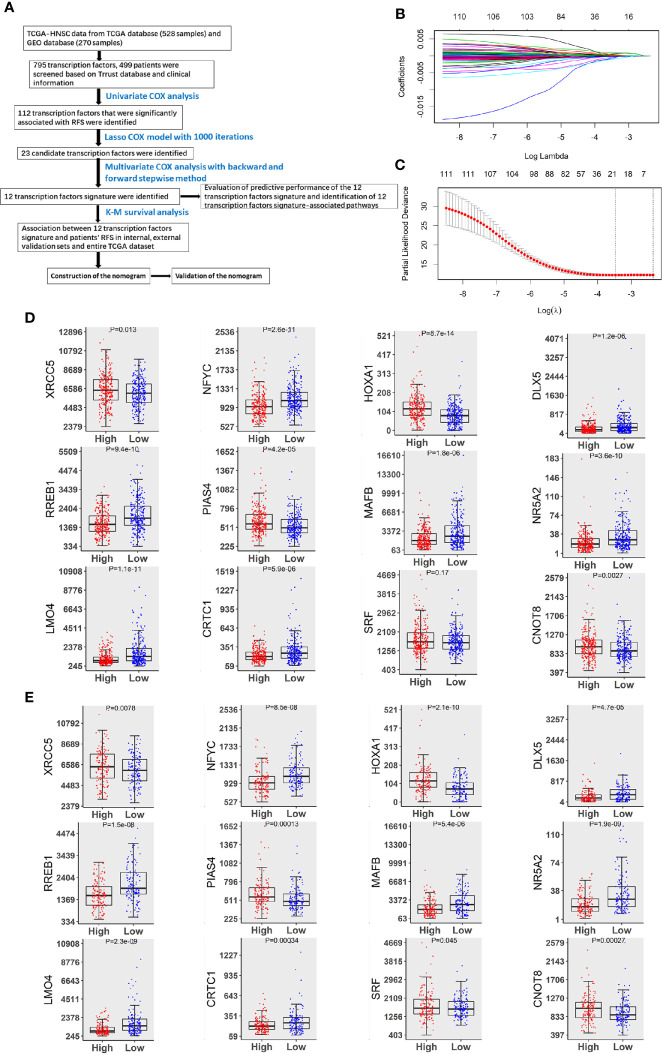
Figure 1.
Identification of TFs predicting RFS in patients with HNSCC. (A) The flow chart of how to identify TFs associated with RFS in HNSCC. (B) 10-fold cross-validation for tuning parameter selection in the LASSO model by minimum criteria (the 1-SE criteria). (C) LASSO coefficient profiles of the 112 TFs genes. A coefficient profile plot was conducted against log (lambda) sequence. Vertical line was drawn at the value selected with 10-fold cross-validation, in which optimal lambda led to 23 non-zero coefficients. (D) Boxplots of the 12 TFs expression values against risk group in the TCGA dataset. “High” and “Low” referred to the high-risk and low-risk clusters, respectively. The differences between the 2 clusters were evaluated by Mann-Whitney U test, and P values were observed in the graphs. (E) Boxplots of 12 TFs expression values against risk cluster in the GEO dataset.

