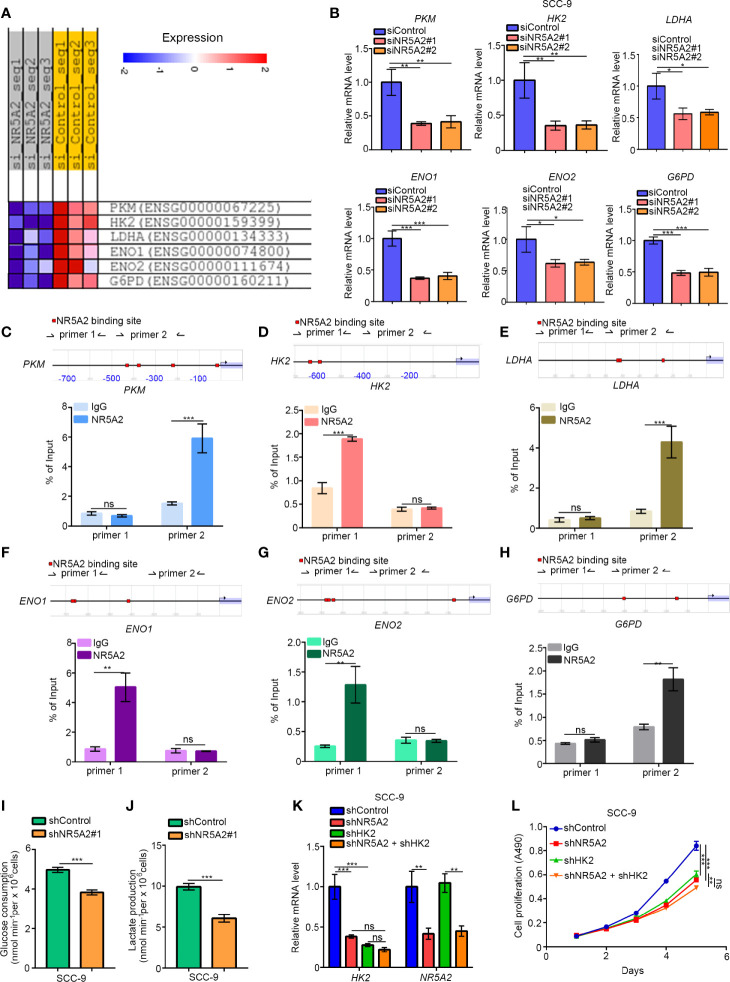
Figure 7.
NR5A2 regulates glycolysis independently of p53. (A), heatmap to show the genes related to glycolysis after knocking down of NR5A2 or not in FaDu cells. (B), SCC-9 cells was infected with the specific siRNAs. After 48 h, cells were subjected to the RT-qPCR analysis. Data are shown as means ± SD (n = 3). *P < 0.05; **P < 0.01; ***P < 0.001. (C–H), the ChIP-qPCR analysis of SCC-9 cells. Data are shown as means ± SD (n = 3). n.s, not significant; **P < 0.01; ***P < 0.001. (I, J), SCC-9 cells were infected with indicated shRNAs. After 48 h, the spent medium of cells was changed with the fresh medium for another 24 h. The spent medium was collected for the measurement of glucose consumption (I) and lactate production (J). The data shown are the mean values ± SD from three replicates. ***P < 0.001. (K, L), SCC-9 cells were infected with indicated shRNAs. After 48 h, cells were harvested for RT-qPCR analysis and MTS assay. Data are shown as means ± SD (n = 3). n.s, not significant; **P < 0.01; ***P < 0.001.

