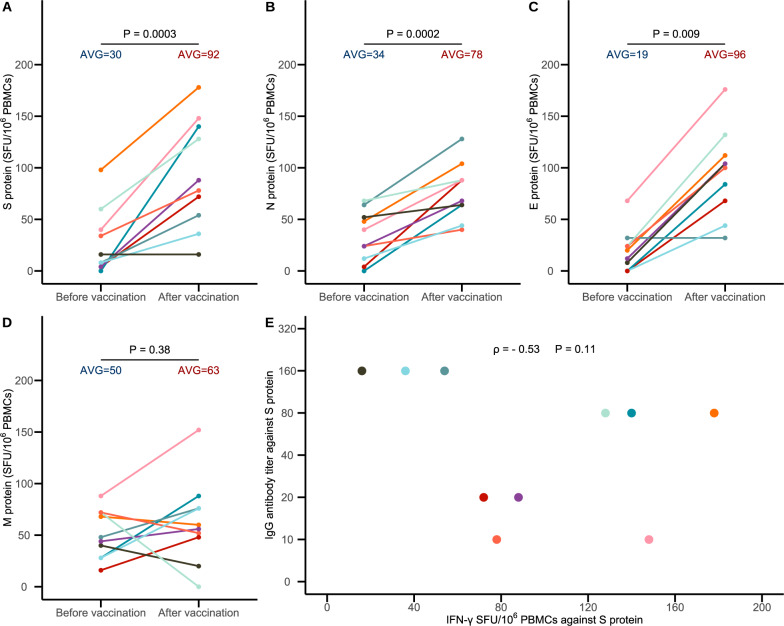
Fig. 1.
T-cell responses against SARS-CoV-2 peptide pools and IgG antibody titers against the SARS-CoV-2 S protein in BBIBP-CorV recipients. A–D The T-cell responses against SARS-CoV-2 spike (S), nucleocapsid (N), envelope (E), and membrane (M) peptide pools, respectively. The T-cell response was measured as IFN-γ spot forming units (SFU) per 106 peripheral blood mononuclear cells (PBMCs). The mean IFN-γ SFU per 106 PBMCs was obtained and compared before and after vaccination. The differences were tested using paired t tests (A, B, and D) or Wilcoxon signed-rank tests (C). The P value is given (horizontal line) for each comparison. Panel E shows the correlation between T-cell responses and IgG antibody titers against the SARS-CoV-2 S protein in BBIBP-CorV recipients 12 weeks after the second dose. Spearman’s correlation coefficient was used to determine the correlation between the IgG antibody titer and IFN-γ SFU against the S protein. All the data in Fig. 1A–E from the 10 persons are labeled with different colors

