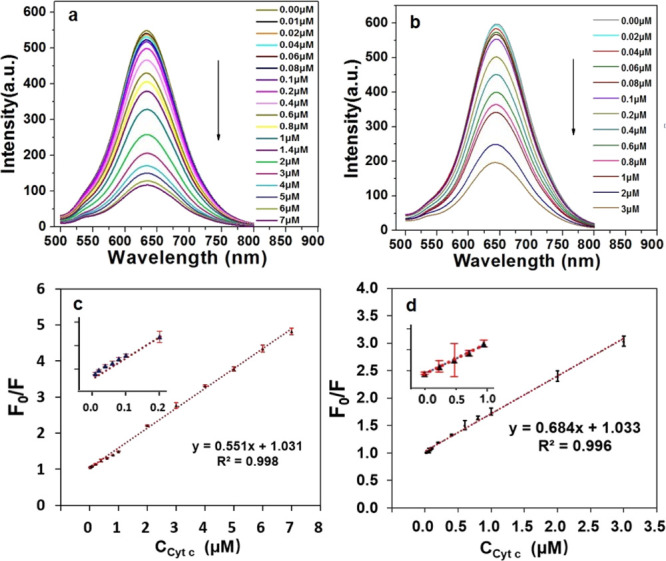
Figure 4.

Fluorescence spectra of CuInS2-ZnS-GSH QDs (a) and CuInS2-ZnS-Cys QDs (b) in the presence of various concentrations of Cyt c in PBS aqueous solution (pH 9). Calibration graph of CuInS2-ZnS-GSH QDs (c) and CuInS2-ZnS-Cys QDs (d) for Cyt c detection. The error bars represent the standard deviations from the mean of three independent experiments.
