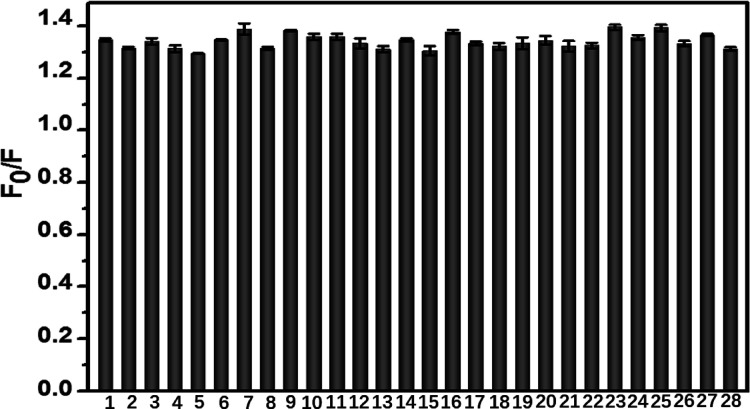
Figure 5.
Selectivity of CuInS2-ZnS-GSH QDs for Cyt c determination. From column 1 to 11, Cyt c is mixed with different small biomolecules (Cys, Glc, Asp, Tyr, Lys, Thr, Ser, Arg, Glu, ATP, or urea) in a solution at a molar concentration ratio of 1:500. From column 12 to 21, Cyt c is mixed with different ions (Fe3+, Na+, K+, Fe2+, Ca2+, Mg2+, CO32–, Cl–, SO42–, or NO3–) at a molar concentration ratio of 1:200. From column 22 to 27, Cyt c is mixed with different proteins (BSA, Hb, HSA, Mb, Lyz, or IgG) at a molar concentration ratio of 1:5. Column 28 is only Cyt c without other interferences. The concentration of Cyt c is fixed at 0.4 μmol L–1. The error bars represent the standard deviations from the mean of three independent experiments.

