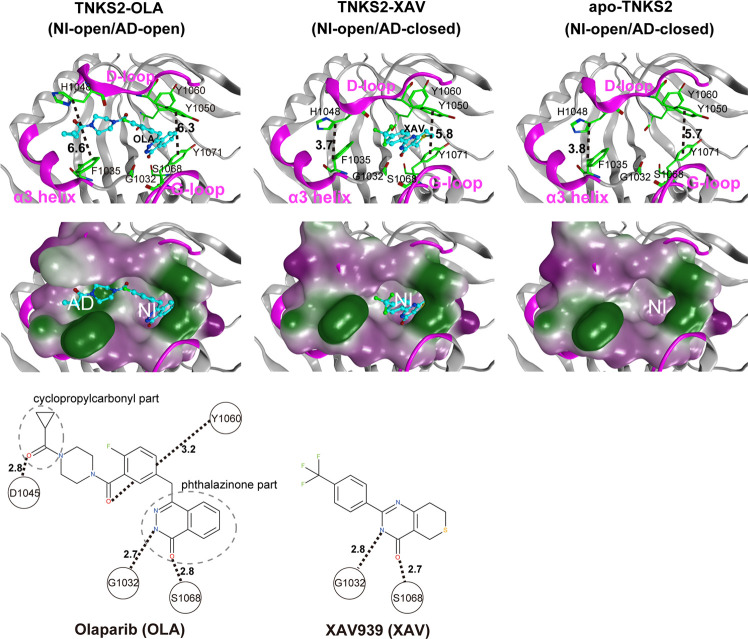
Figure 1.
X-ray crystallographic structures of the pocket conformation of tankyrase2-olaparib (TNKS2–OLA) complex, tankyrase2-XAV939 (TNKS2–XAV) complex, and unbound-tankyrase2 (apo-TNKS2). The X-ray crystallographic structures of pocket conformations of the TNKS2–OLA complex, the TNKS2–XAV complex, and apo-TNKS2 are shown in left, center, and right panels, respectively. Top figures show the conformations of the ligand binding pockets. Several key residues (Gly1032, Phe1035, His1048, Tyr1050, Tyr1060, Ser1068, and Tyr1071) are shown using a green stick model. The α3 helix, D-loop, and G-loop regions are shown in magenta. The bound ligands are shown using a ball-and-stick model in cyan. The black dotted lines indicate the distance between the geometric center of the Tyr1050 phenyl ring and that of the Tyr1070 (the ring distance of Tyr1050–Tyr1071) (Å) and the minimum distances between Phe1035 and His1048 (the minimum distance of Phe1035–His1048) (Å). The middle figures show the ligand binding pockets depicted using a molecular surface representation. The hydrophilic and lipophilic regions are drawn in purple and green, respectively. The bottom figures illustrate the structural formula of each ligand. The black dotted lines with numerals represent the distances of hydrogen bonds between the ligand and the amino acids in the binding pocket. AD, adenosine subsite; NI, nicotinamide subsite.

