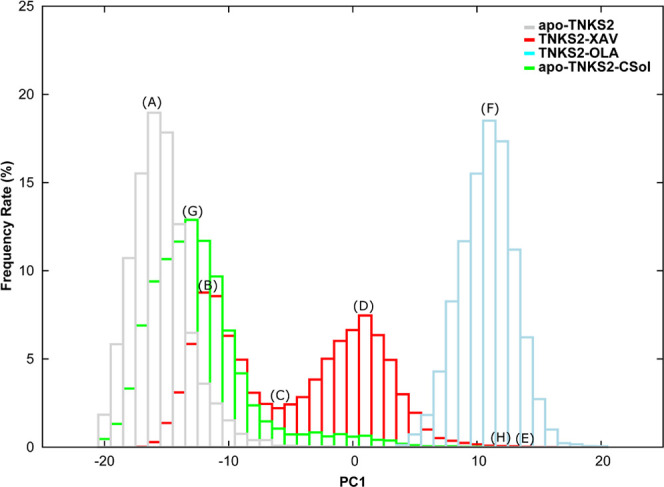
Figure 5.

PC1 value histograms of MD simulations of apo-TNKS2, TNKS2–XAV complex, TNKS2–OLA complex, and apo-TNKS2-CSol. Gray, red, cyan, and green boxes indicate the occurrence frequency rate of apo-TNKS2, TNKS2–XAV complex, TNKS2–OLA complex, and apo-TNKS2-CSol, respectively. The abscissa represents the PC1 value, and the ordinate represents the appearance frequency rate (%) of conformations (A–H), thus indicating the representative positions of the respective histograms. (A) The PC1 value peak for apo-TNKS2. (B, D) Two different PC1 value peaks for the TNKS2–XAV complex. (C) The valley between two different PC1 value peaks of the TNKS2–XAV complex. (E) The maximum PC1 value for the TNKS2–XAV complex. (F) The PC1 value peak of the TNKS2–OLA complex. (G, H) The peak and maximum PC1 value of apo-TNKS2-CSol.
