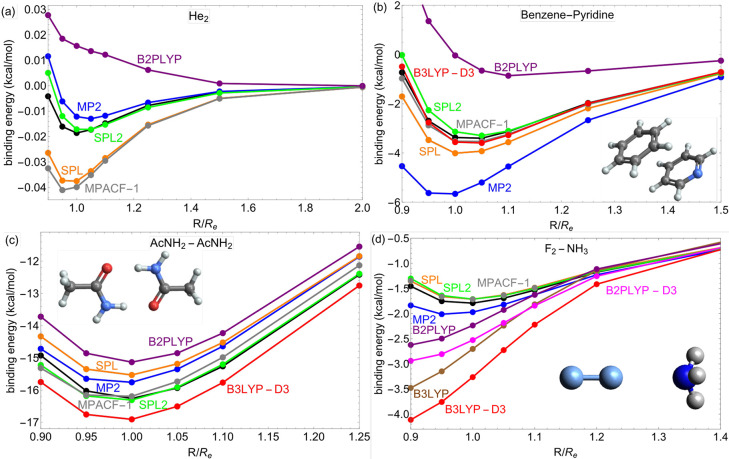
Figure 4.
Dissociation curves of He2 (a), benzene–pyridine (b), acetamide (c), and NH3–F2 dimers (d), obtained from various methods. CCSD(T) (black line) has been used as a reference for all complexes. For other binding curves, see Figures S3–S8 in the Supporting Information.

