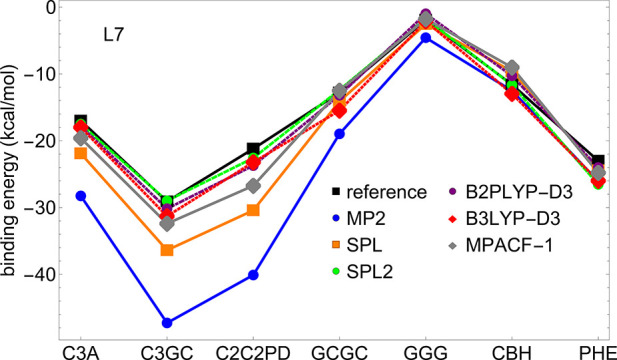
Figure 5.

Interaction energies of MP2, SPL, SPL2, B3LYP-D3, and B2PLYP as well as reference data of Grimme and co-workers,36 plotted for individual complexes of the L7 data set. For comparison of the approximations against other reference data, see Figure S2 and Table S2 in the Supporting Information.
