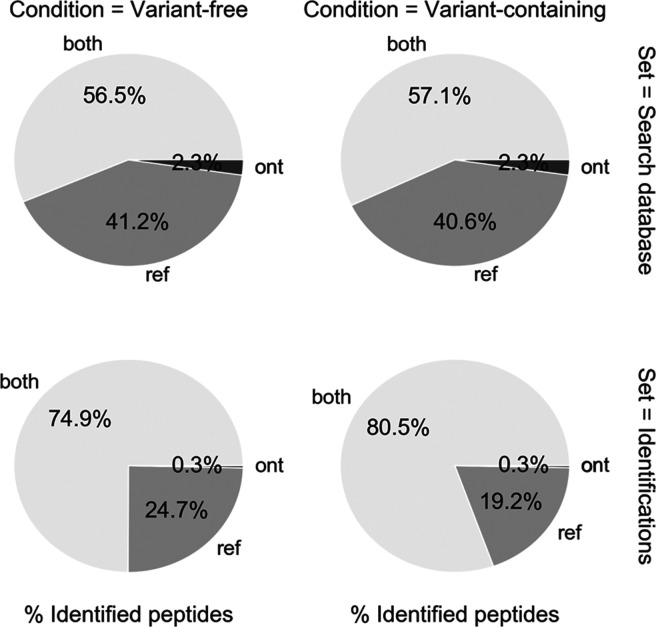
Figure 2.
Detectable peptides per method. Theoretical (upper pie charts) and observed (lower pie charts) proportions of peptides when searching against VC (right) or VF (left) search databases. This shows percentages of matched peptides attributed only to GENCODE proteins, only ONT proteins, and those that match to proteins in both databases.

