
Figure 4.
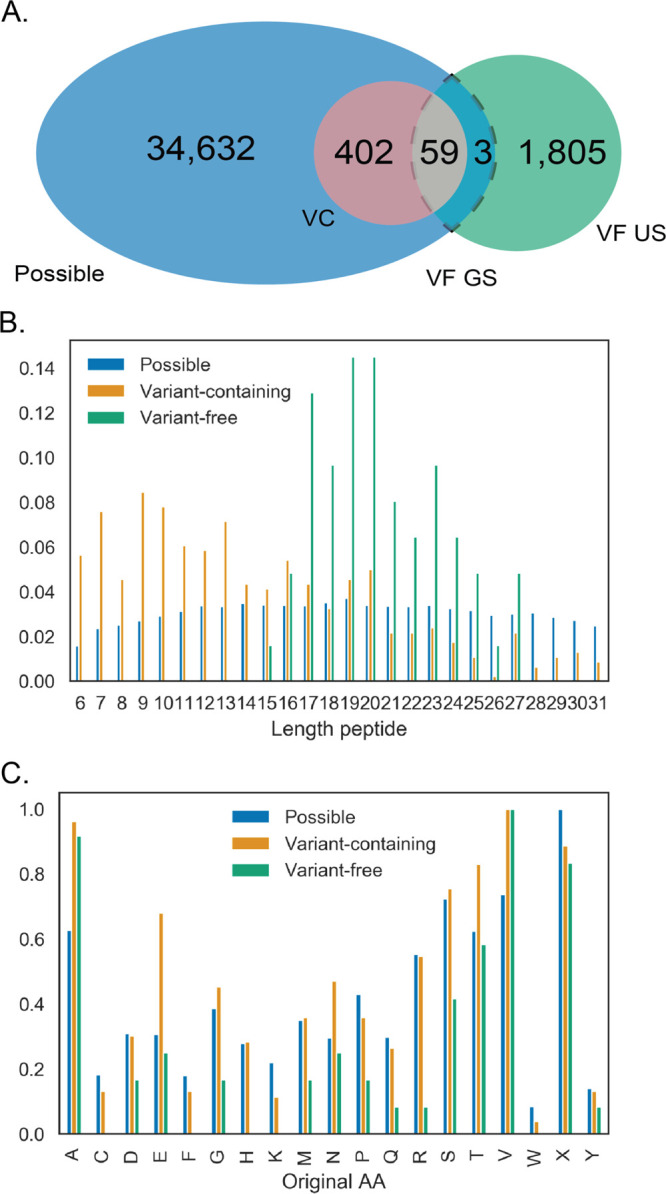
Properties of detected variants compared to those expected. (A) Groups of variant peptides being compared. All circles, including all overlaps, are being compared to each other. (B) Length distribution differences between detected variant peptides by the different variant detection methods. (C) Normalized (divided by max) frequency of variation per original (reference) amino acid.