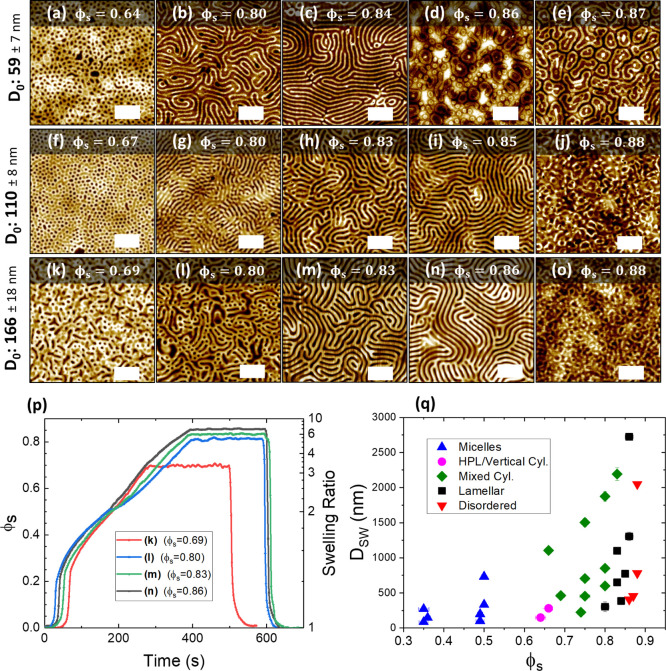
Figure 2.
AFM images (a–o) show PS-b-P2VP films of varying thicknesses annealed in 2:1 chloroform/THF vapor up to a range of solvent concentration (ϕs) values. All scale bars are 1 μm. Once the targeted value of ϕs was reached, the films were held at this value for approximately 200 s before being rapidly quenched in order to preserve the phase-separated structure. (p) Examples of solvent uptake plots for (k–n) during SVA, with the corresponding ϕs value shown in the inset that the film was held at for 200 s. (q) is an orientation diagram of the swollen film thickness Dsw as a function of ϕs, with the color of each data point conveying the resulting morphology of the film post-SVA.

