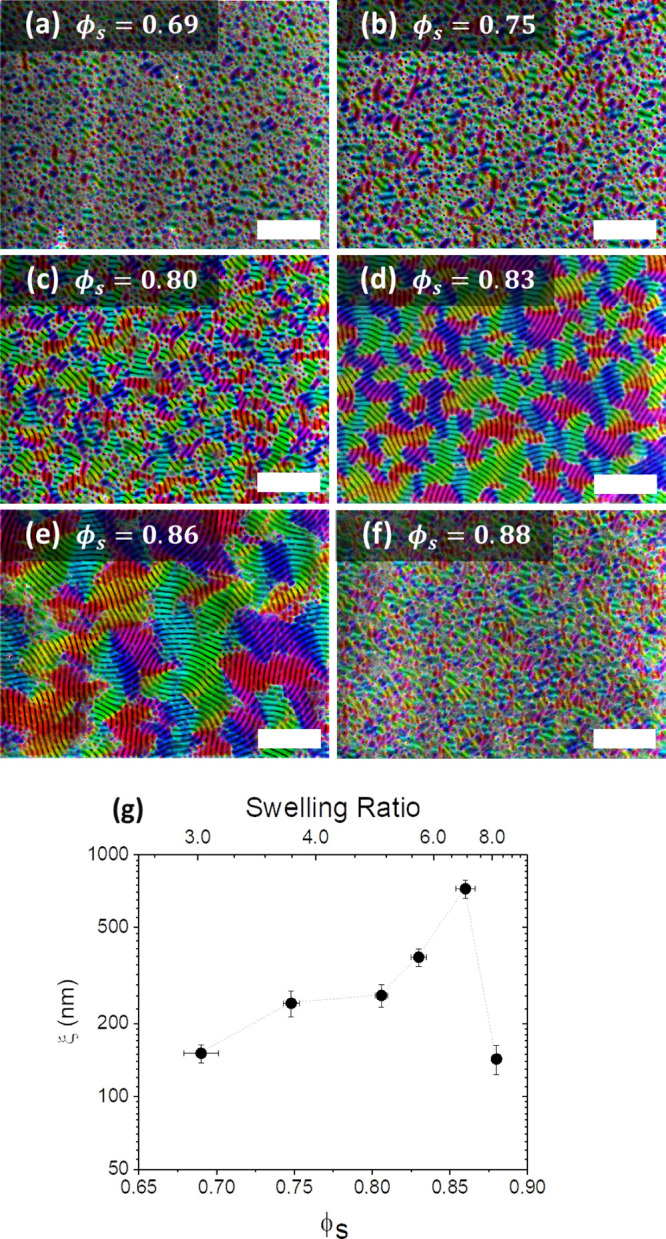
Figure 3.

(a–d) Orientational mapping of scanning electron microscopy (SEM) images showing grains parallel to the surface after swelling to different values of solvent concentration (ϕs): (a) ϕs = 0.69, (b) ϕs = 0.75, (c) ϕs = 0.80, (d) ϕs = 0.83, (e) ϕs = 0.86, (f) ϕs = 0.88, and (g) correlation length ξ as a function of ϕs and swelling ratio. Scale bars are 2 μm.
