
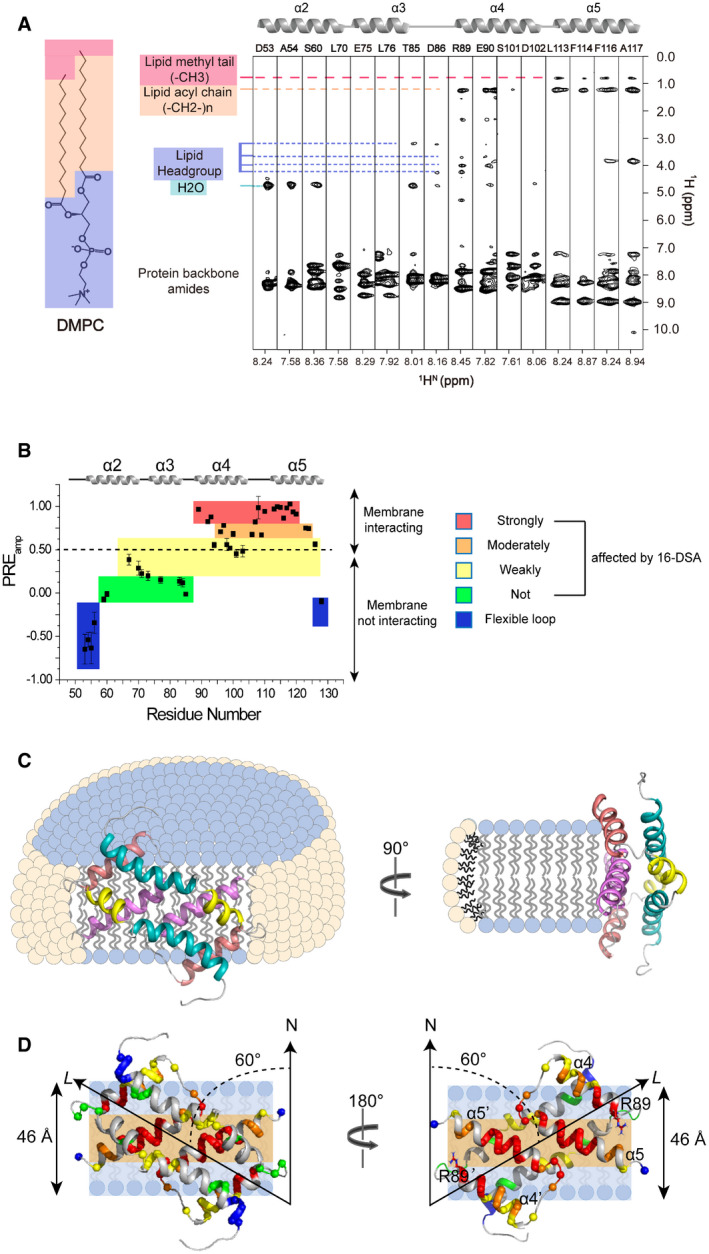
Figure 3. Interaction of Bax (α2–α5) with lipid bicelles.
-
ANOE strips taken from 3D 15N‐edited NOESY‐TROSY‐HSQC spectrum (200‐ms NOE mixing time) recorded at 900 MHz using the [15N, 2H]‐labeled Bax (α2–α5) in DMPC/DHPC bicelles with q = 0.55. The indicated crosspeaks in the aliphatic regions are the NOEs between the protein backbone amide protons and the lipid aliphatic protons.
-
BResidue‐specific PREamp of Bax (α2–α5) in DMPC/DHPC bicelles with q = 0.6 determined from the lipophilic PRE analysis. The PREamp values were derived from the 16‐DSA titration. The plot is colored according to the PREamp values that are proportional to the effects of 16‐DSA on the individual residues of Bax (α2–α5). The residues with the least PREamp values in the blue colored areas are in the flexible terminal regions.
-
CSchematics of a Bax (α2–α5) dimer structure in ribbon representation relative to a bicelle with DMPC (blue) in the lipid bilayer and DHPC (pale yellow) in the rim. The protein structure contacts the DMPC lipid bilayer directly with a 60° tilt angle, which is illustrate more clearly by the schematic (D).
-
DPosition of a Bax (α2–α5) dimer structure in ribbon representation relative to the lipid bilayer of a bicelle. The protein structure is placed against the lipid bilayer with a 60° tilt angle between its longest axis (L) and the bilayer normal axis (N) as derived from the best sigmoidal fitting. The hydrophobic α4–α5 surface contacts the lipid bilayer. Amide protons are shown as spheres color‐coded similarly as in panel B. The polar headgroup region and the nonpolar acyl tail region of the lipid bilayer are indicated by light blue and light orange colored strips, respectively. The estimated thickness for the DMPC lipid bilayer is indicated on the left side. The Bax (α2–α5) dimer structure on the left is rotated 180° to generate the structure on the right showing the nonpolar residues in the α4–α5 surface, most of which contact the nonpolar core of the lipid bilayer. Note that the two positively charged R89 residues on the boundary of the nonpolar surface are close to the polar lipid headgroups.
Source data are available online for this figure.