
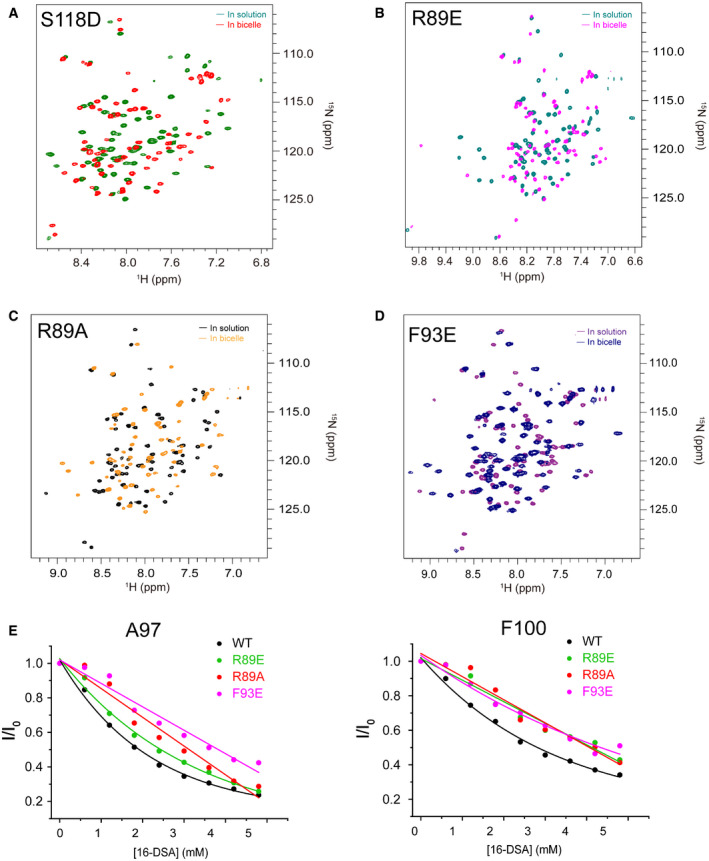
Figure EV3. Interactions of Bax (α2–α5) mutants with lipid bicelles.
-
A–DSuperimposed 2D 1H–15N TROSY‐HSQC spectra of (A) bicelle‐bound (green) and soluble (red) Bax (α2–α5) S118D, (B) bicelle‐bound (teal) and soluble (magenta) Bax (α2–α5) R89E, (C) bicelle‐bound (yellow) and soluble (black) Bax (α2–α5) R89A, and (D) bicelle‐bound (blue) and soluble (purple) Bax (α2–α5) F93E recorded at 600 MHz.
-
ESpectral peak intensity decay (I/I0) for A97 and F100 caused by PRE agent 16‐DSA, determined from a series of 1H–15NTROSY‐HSQC spectra of bicelle‐bound Bax (α2–α5) (black) or the R89E (green), R89A (red) and F93E (magenta) mutants recorded at different [16‐DSA]. I/I0 = the peak intensity in the presence 16‐DSA/that in the absence of 16‐DSA.
Source data are available online for this figure.