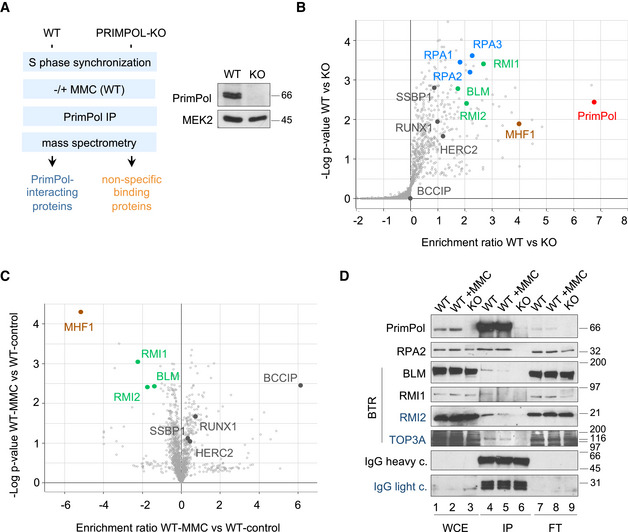
Figure 1. PrimPol interacts with factors involved in ICL traverse.

- Experimental design for the proteomic identification of PrimPol‐interacting factors in S phase‐synchronized cells. Immunoblot showing PrimPol levels in WT and KO cells. MEK2 is shown as loading control.
- Volcano plot showing statistical significance (−log P‐value) vs. enrichment ratio (log2) of identified proteins after PrimPol immunoprecipitation in WT and KO cells. The positions of PrimPol, RPA1‐3, BLM, RMI1, RMI2, MHF1, SSBP1, RUNX1, HERC2, and BCCIP proteins are indicated.
- Volcano plot showing statistical significance (−log P‐value) vs. enrichment ratio (log2) of identified proteins after PrimPol immunoprecipitation in WT cells with or without MMC (2 µg/ml; 5 h). BLM, RMI1, RMI2, MHF1, SSBP1, RUNX1, HERC2, and BCCIP proteins are indicated.
- Immunoblot detection of the indicated proteins in whole cell extracts (WCE), PrimPol immunoprecipitates (IP), and non‐precipitated flow‐through fractions (FT). IgG shows the presence of anti‐PrimPol antibody in the IP fractions (lanes 4–6). Protein names in black and blue indicate the two different gels used.
Source data are available online for this figure.
