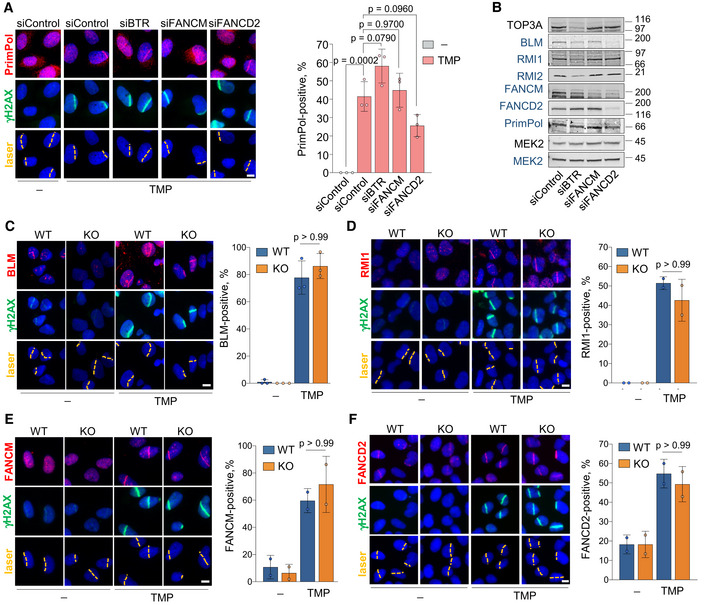
Figure EV2. (related to Fig 2). Independent binding of PRIMPOL, BTR, FANCM, and FANCD2 to ICL‐containing DNA.

-
AConfocal microscopy images of PrimPol and γH2AX immunofluorescence (IF) in control (UVA) or TMP‐UVA‐treated cells following downregulation of the indicated factors. Nuclear DNA is counterstained with DAPI. The UVA laser path is indicated. Scale bar, 10 µm. Histograms (right panel) show the average and SD of the percentage of cells that are PrimPol‐positive in the laser path in three assays (n ≥ 100 cells per TMP‐treated conditions in each replicate). Circle dots in each column represent the values of individual replicates. Statistical analysis was conducted with one‐way ANOVA followed by Bonferroni post‐test. The p‐values of the indicated comparisons are shown.
-
BImmunoblots showing the levels of the indicated proteins after siRNA‐mediated downregulation. siBTR is a combination of siBLM, siTOP3A, siRMI1, and siRMI2. MEK2 is shown as loading control. Protein names in black and blue indicate the two different gels used.
-
C–FConfocal microscopy images of BLM (C), RMI1 (D), FANCM (E), or FANCD2 (F) together with γH2AX IF staining in control (UVA) or TMP‐UVA‐laser irradiated WT or PRIMPOL KO cells, as in (A). Scale bar, 10 µm. Histograms (right panels) show the average percentage of cells positive for the recruitment of the indicated factor to the laser path. Average and SD of at least two assays are shown (n ≥ 100 cells per TMP‐treated conditions in each replicate). Circle dots in each column represent the values of individual replicates. Statistical analysis was conducted with one‐way ANOVA followed by Bonferroni post‐test. P‐values of the indicated comparisons are included.
Source data are available online for this figure.
