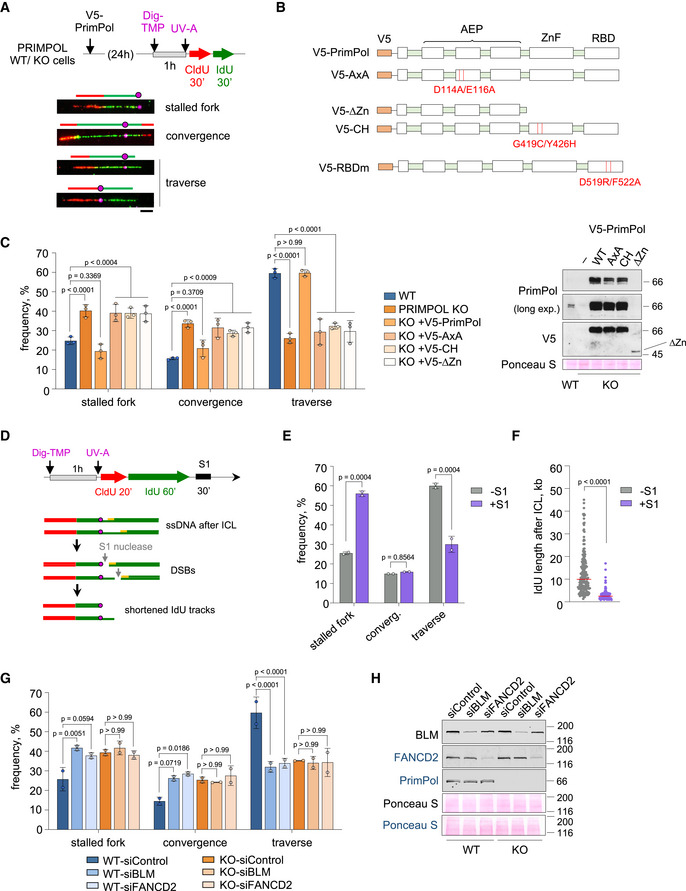
Figure 3. PrimPol mediates the ICL traverse reaction through its primase activity.

- Experimental design and examples of stretched DNA fibers with different patterns of DNA synthesis around the ICL lesion. Fibers were stained with anti‐CldU (red), anti‐IdU (green), and anti‐Dig (magenta). Schematics over the fiber images highlight the position of the ICL (circle) in each replicative structure. Scale bar, 10 µm.
- PrimPol mutants used in the experiments. AxA is a PrimPol catalytic mutant. ∆Zn and CH are primase‐null, polymerase‐proficient PrimPol mutants. RBDm is a PrimPol mutant defective for RPA‐binding.
- Histograms show the percentage of the different replication patterns observed in each experimental condition (average and SD of three assays). Circle dots in each column represent the values of individual replicates. Statistical analysis: two‐way ANOVA followed by Bonferroni post‐test comparing each condition to the WT. P‐values of individual comparisons are indicated. Immunoblots showing the levels of V5‐PrimPol proteins (WT and mutant derivatives). Ponceau S staining is shown as loading control.
- Experimental design of ICL‐localized DNA fibers followed by S1 nuclease incubation. Hypothetical fiber containing ssDNA downstream of the ICL (circle) turns into a DSB after S1 nuclease action. This would lead to an increase in apparent stalled forks or shortening of IdU length downstream of the lesion.
- Histograms show the percentage of the different replication patterns observed in each experimental condition (average and SD of two assays). Circle dots in each column represent the values of individual replicates. Statistical analysis: two‐way ANOVA followed by Bonferroni post‐test. P‐values of individual comparisons are indicated.
- Dot plot shows the distribution and median (horizontal red line) of IdU track length after an event of ICL traverse in each condition. Data pooled from two replicates are represented (n ≥ 100 cells per condition). Statistical analysis was conducted with Kruskal–Wallis test and Dunn’s post‐test. P‐values of individual comparisons are indicated.
- Histograms show the percentage of the different replication patterns observed in each experimental condition (average and SD of two assays). Circle dots in each column represent the values of individual replicates. Statistical analysis: two‐way ANOVA followed by Bonferroni post‐test. P‐values of individual comparisons are indicated.
- Immunoblots showing the levels of BLM, FANCD2, and PrimPol after BLM or FANCD2 downregulation in WT and PRIMPOL KO cells for experiments in (G). Ponceau S is shown as loading control. Protein names in black and blue indicate the two different gels used.
Source data are available online for this figure.
