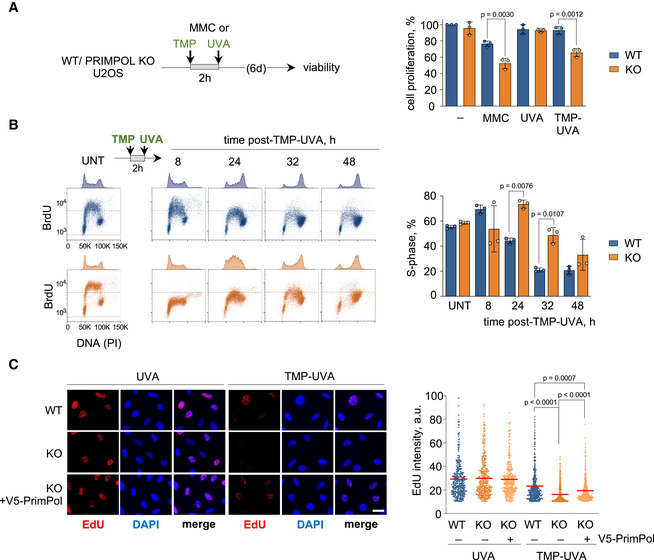
Figure 4. PrimPol ablation impairs cell proliferation and DNA synthesis in the presence of ICLs.

- CellTiter‐Glo viability assays in WT and PRIMPOL KO cells 6 days after treatment with 1 µg/ml MMC (2 h) or TMP‐UVA (2 µM TMP, 2 h followed by 5 s irradiation). Histograms represent the total number of viable cells (average and SD of three assays) at the end of the experiment, expressed as percentage of the number of untreated cells. Circle dots in each column represent the values of individual replicates. Statistical analysis was conducted with one‐way ANOVA and Bonferroni post‐test. P‐values of individual comparisons are indicated.
- Flow cytometry profiles of BrdU incorporation (y‐axis) vs DNA content (PI; x‐axis) in WT (blue) and PRIMPOL KO (orange) cells, either collected without treatment (UNT) or at the indicated times after exposure to TMP‐UVA (2 µM TMP for 2 h followed by 5 s irradiation). DNA content profiles are shown on top of the boxes (cell count). Dashed horizontal lines inside panels are included for comparative purposes between WT and KO BrdU incorporation levels. Histograms (right panel) represent the percentage of cells in S‐phase in each condition (average and SD of three assays). Circle dots in each column represent the values of individual replicates. Statistical analysis in all cases was conducted with one‐way ANOVA and Bonferroni post‐test. P‐values of individual comparisons are indicated.
- Representative confocal microscopy images of EdU staining in WT and PRIMPOL KO cells, 8 h after UVA (control) or TMP‐UVA treatment (2 µM TMP, 2 h followed by 5 s irradiation). Nuclear DNA is counterstained with DAPI. When indicated, V5‐PrimPol was reintroduced into KO cells. Scale bar, 25 µm. Dot plots indicate the distribution of nuclear EdU intensity, and the mean values are indicated by horizontal red lines. Data from the combination of three replicates (n ≥ 200 cells per condition). Statistical analysis was conducted with Kruskal–Wallis test and Dunn’s post‐test. P‐values of individual comparisons are indicated.
Source data are available online for this figure.
