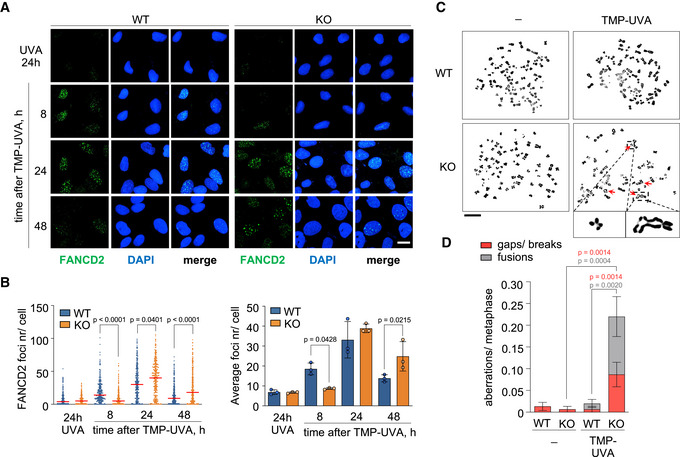
Figure 5. PrimPol deficiency leads to ICL repair defects.

- Confocal microscopy images of FANCD2 immunofluorescence staining in control (UVA) or TMP‐UVA‐treated (2 µM TMP, 2 h followed by 5 s irradiation) WT and PRIMPOL KO cells. Nuclear DNA is counterstained with DAPI. Scale bar, 25 µm.
- Dot plot (left panel) shows the distribution and mean (horizontal red line) of FANCD2 foci number per cell in each condition. Data pooled from three replicates are represented (n ≥ 100 cells per condition). Statistical analysis was conducted with Kruskal–Wallis test and Dunn's post‐test. P‐values of individual comparisons are indicated. Histograms (right panel) show the average foci number and SD of three assays in each case. Circle dots in each column represent the values of individual replicates. Statistical analysis was conducted with one‐way ANOVA followed by Bonferroni post‐test. P‐values of individual comparisons are indicated.
- Metaphase spreads stained with Leishman, obtained from control (‐) or TMP‐UVA‐treated cells (2 µM TMP, 2 h followed by 5 s irradiation). Scale bar, 10 µm. Representative images of chromosomal breaks and fusions are shown at higher magnification.
- Histograms show the number of chromosomal aberrations per metaphase (average and SEM) in each condition. Data taken from three replicates are combined (50 metaphases per replicate). Statistical analysis was conducted with one‐way ANOVA followed by Bonferroni post‐test. P‐values of individual comparisons are indicated.
Source data are available online for this figure.
