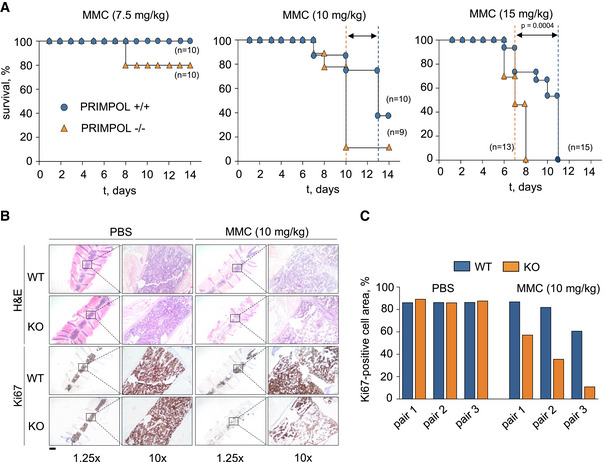
Figure 6. PRIMPOL KO mice are hypersensitive to MMC.

- Kaplan–Meier survival curves of WT and PRIMPOL KO mice after the administration of a single dose of MMC (7.5, 10, or 15 mg/kg). Dashed vertical lines represent median survival values for WT (blue) and KO (orange) mice. Statistical analysis was conducted with Log‐rank (Mantel–Cox) test; P‐value for the highest dose of MMC (15 mg/kg) is indicated.
- Hematoxylin–eosin (H&E) and Ki‐67 immunohistochemistry (IHC) stainings of bone marrow sections derived from WT and PRIMPOL KO mice following the administration of 10 mg/kg MMC. Control mice (PBS) were sacrificed when MMC‐injected mice reached the humane endpoint. Scale bar, 2.5 mm. In each image, a relevant area is shown at higher magnification (10×).
- Histograms show Ki‐67‐positive cellular area in the conditions shown in (B). Results are shown with three pairs of age‐ and gender‐matched WT and KO littermates. When combined, the differences observed between MMC‐treated WT and KO mice were statistically significant (two‐way ANOVA and Bonferroni post‐test, P‐value 0.0044).
Source data are available online for this figure.
