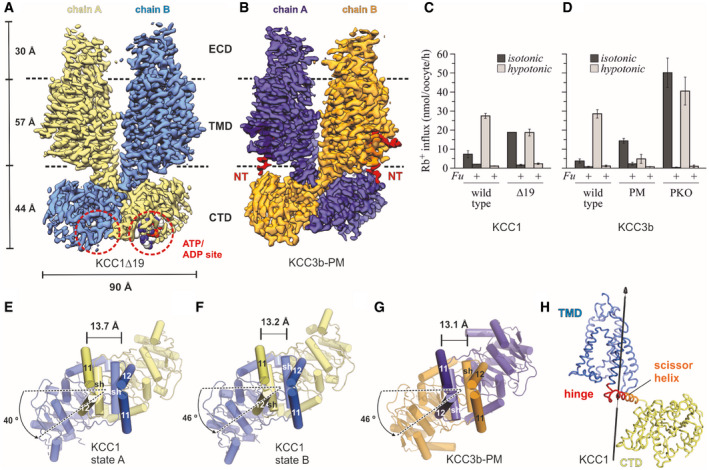
Figure 1. Overall structure and functional characterization of KCC3b‐PM and KCC1Δ19.

-
ADensity map of KCC1Δ19, coloured by protomer. ATP bound to the CTD is represented as spheres.
-
BDensity map of KCC3b‐PM, coloured by protomer, with N‐terminal region highlighted in bright red.
-
C, DRb+ uptake activity of WT and mutant constructs for KCC1 (C) and KCC3b (D) under isotonic (dark grey bars) and hypotonic conditions (light grey bars). Values are mean (± SE) background‐subtracted transport rates of 10 oocytes from 3 to 6 experiments in the presence (indicated by +Fu) or absence of 1.5 mM furosemide.
-
E–GCTD arrangement of KCC1 (construct Δ19) (E, F) and KCC3b (construct PM: S45D/T940D/T997D, panel G). Of the TMD, only TM helices 11 and 12 are shown for clarity. Cα distances (in Å) between marker atoms S634 (KCC1) and S648 (KCC3b) are indicated by a black line.
-
HHinge region (red ribbon representation) for conformational change between state A and B of KCC1 predicted by DynDom (Lee et␣al, 2003).
