-
A
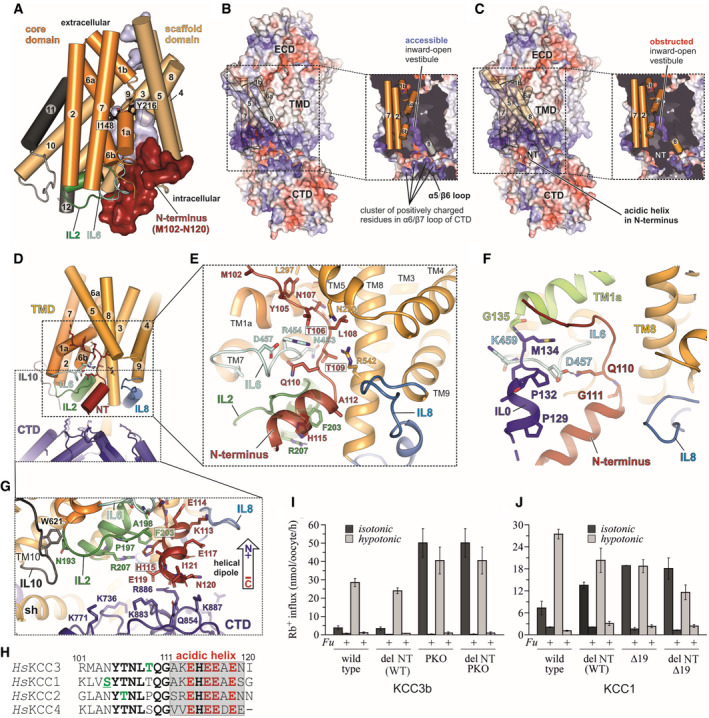
Cartoon representation of the KCC3b‐PM TMD with N‐terminal residues M102‐N120 shown as red surface. The core domain (helices 1, 2, 6, 7) is represented in orange, the scaffold domain (helices 3–5, 8–10) in wheat. Residues I148 and Y216 involved in ion coordination are shown as black sticks.
-
B
Electrostatic surface representations of KCC3b‐PM and slab view of the TMD (inset) in absence of N‐terminal residues M102‐M134. The surface is coloured by electrostatic potential (red, −5 kT e−1; blue,+5 kT e−1).
-
C
Same as in (B), but with N‐terminal residues included, highlighting the obstruction of the inward‐open vestibule.
-
D
Cartoon representation of TMD (yellow), intracellular loops (blue, green and light cyan), CTD (deep blue) and N‐terminus (dark red).
-
E
Conserved polar residues (stick representation) in the N‐terminus interact with IL6 (light cyan), IL2 (green), TM5 and TM8. IL0 is omitted for clarity.
-
F
N‐terminal “triangular” extension formed by residues M102‐M134 prior to TM1a (lime green helix). IL0 (blue helix) and NT (dark red) are stabilized by interactions to IL6 (light cyan).
-
G
Stabilization of acidic helix in N‐terminus (red cartoon) by Pi‐stacking to F203 in IL2 (green sticks) and backbone carbonyl interactions to positively charged residues in the CTD (deep blue sticks).
-
H
Sequence alignment of N‐terminal segments from human KCCs with phosphorylation sites highlighted in green. Underscored letters represent phosphorylation sites confirmed experimentally in this study.
-
I
Rb+ uptake activity under isotonic and hypotonic conditions for KCC3b variants with internally deleted R101‐I121, introduced to KCC3b‐WT and KCC3b‐PKO, respectively. Values are mean (± SE) background‐subtracted transport rates of 10 oocytes from 3‐6 experiments in the presence or absence of 1.5 mM furosemide (indicated by +/− Fu).
-
J
Rb+ uptake activity under isotonic and hypotonic conditions for KCC1 (WT and Δ19), and the respective constructs with an internal deletion of residues K85‐G105. Values are mean (± SE) background‐subtracted transport rates of 10 oocytes from 3 to 6 experiments in the presence (indicated by +Fu) or absence of 1.5 mM furosemide.

